
为了更快的定位您的问题,请提供以下信息,谢谢
【详述】问题详细描述
监控上显示 三台机器 其中一台 系统盘(vda1)io被打满


仅部署了be
be.out:
branch-3.3.17 RELEASE (build ffe5098)
query_id:9078eef7-82c8-11f0-a4bc-024293699b6f, fragment_instance:9078eef7-82c8-11f0-a4bc-024293699b70
tracker:process consumption: 19999990320
tracker:jemalloc_metadata consumption: 1011858032
tracker:query_pool consumption: 7341621832
tracker:query_pool/connector_scan consumption: 0
tracker:load consumption: 380429984
tracker:metadata consumption: 6539393649
tracker:tablet_metadata consumption: 810978621
tracker:rowset_metadata consumption: 230261350
tracker:segment_metadata consumption: 785201864
tracker:column_metadata consumption: 4712951814
tracker:tablet_schema consumption: 4884997
tracker:segment_zonemap consumption: 735610747
tracker:short_key_index consumption: 3559271
tracker:column_zonemap_index consumption: 1522048118
tracker:ordinal_index consumption: 1042280496
tracker:bitmap_index consumption: 0
tracker:bloom_filter_index consumption: 0
tracker:compaction consumption: 0
tracker:schema_change consumption: 0
tracker:column_pool consumption: 0
tracker:page_cache consumption: 0
tracker:jit_cache consumption: 0
tracker:update consumption: 123155
tracker:chunk_allocator consumption: 0
tracker:passthrough consumption: 3047696
tracker:clone consumption: 0
tracker:consistency consumption: 0
tracker:datacache consumption: 223427205
tracker:replication consumption: 0
*** Aborted at 1756245837 (unix time) try “date -d @1756245837” if you are using GNU date ***
PC: @ 0x4fafefb starrocks::CurrentThread::MemCacheManager::commit(bool)
*** SIGSEGV (@0x0) received by PID 25 (TID 0x7f0100b63640) from PID 0; stack trace: ***
@ 0x7f033b9eaee8 (/usr/lib/x86_64-linux-gnu/libc.so.6+0x99ee7)
@ 0x9b1ba89 google::(anonymous namespace)::FailureSignalHandler(int, siginfo_t*, void*)
@ 0x7f033c87e526 os::Linux::chained_handler(int, siginfo_t*, void*)
@ 0x7f033c88421b JVM_handle_linux_signal
@ 0x7f033c87707c signalHandler(int, siginfo_t*, void*)
@ 0x7f033b993520 (/usr/lib/x86_64-linux-gnu/libc.so.6+0x4251f)
@ 0x4fafefb starrocks::CurrentThread::MemCacheManager::commit(bool)
@ 0x748d3e2 std::_Function_handler<void (), starrocks::io::AsyncFlushOutputStream::close()::{lambda()#1}>::_M_invoke(std::_Any_data const&)
@ 0x4f8007d starrocks::PriorityThreadPool::work_thread(int)
@ 0x9ace5bb thread_proxy
@ 0x7f033b9e5ac3 (/usr/lib/x86_64-linux-gnu/libc.so.6+0x94ac2)
@ 0x7f033ba76a04 clone
[1756245838.312][thread:139642283636288] je_mallctl execute purge success
[1756245838.312][thread:139642283636288] je_mallctl execute dontdump success
start time: Wed Aug 27 06:08:03 CST 2025, server uptime: 06:08:03 up 151 days, 10:09, 0 users, load average: 92.77, 83.49, 44.45
log4j:WARN No appenders could be found for logger (software.amazon.awssdk.thirdparty.org.apache.http.client.protocol.RequestAddCookies).
log4j:WARN Please initialize the log4j system properly.
log4j:WARN See http://logging.apache.org/log4j/1.2/faq.html#noconfig for more info.
log4j:WARN No appenders could be found for logger (software.amazon.awssdk.thirdparty.org.apache.http.client.protocol.RequestAddCookies).
log4j:WARN Please initialize the log4j system properly.
log4j:WARN See http://logging.apache.org/log4j/1.2/faq.html#noconfig for more info.
log4j:WARN No appenders could be found for logger (software.amazon.awssdk.thirdparty.org.apache.http.client.protocol.RequestAddCookies).
log4j:WARN Please initialize the log4j system properly.
log4j:WARN See http://logging.apache.org/log4j/1.2/faq.html#noconfig for more info.
log4j:WARN No appenders could be found for logger (software.amazon.awssdk.thirdparty.org.apache.http.client.protocol.RequestAddCookies).
log4j:WARN Please initialize the log4j system properly.
log4j:WARN See http://logging.apache.org/log4j/1.2/faq.html#noconfig for more info.
log4j:WARN No appenders could be found for logger (software.amazon.awssdk.thirdparty.org.apache.http.client.protocol.RequestAddCookies).
log4j:WARN Please initialize the log4j system properly.
log4j:WARN See http://logging.apache.org/log4j/1.2/faq.html#noconfig for more info.
log4j:WARN No appenders could be found for logger (software.amazon.awssdk.thirdparty.org.apache.http.client.protocol.RequestAddCookies).
log4j:WARN Please initialize the log4j system properly.
log4j:WARN See http://logging.apache.org/log4j/1.2/faq.html#noconfig for more info.
WARNING: An illegal reflective access operation has occurred
WARNING: Illegal reflective access by com.esotericsoftware.kryo.util.UnsafeUtil (file:/opt/starrocks/be/lib/iceberg-reader-lib/kryo-shaded-4.0.2.jar) to constructor java.nio.DirectByteBuffer(long,int,java.lang.Object)
WARNING: Please consider reporting this to the maintainers of com.esotericsoftware.kryo.util.UnsafeUtil
WARNING: Use --illegal-access=warn to enable warnings of further illegal reflective access operations
WARNING: All illegal access operations will be denied in a future release
fe.audit.log: 写入iceberg数据湖
2025-08-27 06:03:58.251+08:00 [query] |Timestamp=1756245837740|Client=172.17.7.10:59398|User=cubeuser|AuthorizedUser=‘cubeuser’@’%’|ResourceGroup=load_resource_group|Catalog=lake|Db=saas_datalake|State=OK|ErrorCode=|Time=511|ScanBytes=0|ScanRows=0|ReturnRows=0|StmtId=4273128|QueryId=9078eef7-82c8-11f0-a4bc-024293699b6f|IsQuery=false|feIp=saas-node13|Stmt=INSERT INTO lake.saas_datalake.ods_api_tb_item_sku_info_du (sku_id,iid,num_iid,properties,properties_name,quantity,price,outer_id,created,modified,status,sku_spec_id,barcode,dt,yuce_cube_shop_id,yuce_tenant_id,yuce_task_instance_id,yuce_data_create_time) SELECT sku_id, iid, num_iid, properties, properties_name, quantity, price, outer_id, created, modified, status, sku_spec_id, barcode, dt, yuce_cube_shop_id, yuce_tenant_id, yuce_task_instance_id, yuce_data_create_time
FROM FILES(“aws.s3.access_key” = “", “aws.s3.enable_ssl” = “false”, “aws.s3.endpoint” = “http://172.17.9.106:9000”, “aws.s3.region” = “us-east-1”, “aws.s3.secret_key” = "”, “format” = “parquet”, “path” = “s3a://broker-load-saas/1756245837527_2IA_ods_api_tb_item_sku_info_du_0.parquet”)|Digest=|Warehouse=default_warehouse|IsForwardToLeader=true|QueryFEAllocatedMemory=4010288
【背景】做过哪些操作?
【业务影响】
影响线上业务稳定性
【是否存算分离】
【StarRocks版本】例如:3.3.17
【集群规模】例如:3fe(3 follower+0observer)+3be(fe与be分开)
【机器信息】CPU虚拟核/内存/网卡,例如:48C/64G/万兆
【联系方式】为了在解决问题过程中能及时联系到您获取一些日志信息,请补充下您的联系方式,例如:社区群4-小李或者邮箱,谢谢
【附件】
- fe.log/beINFO/相应截图
- 慢查询:
- Profile信息,获取Profile,通过Profile分析查询瓶颈
- 并行度:show variables like ‘%parallel_fragment_exec_instance_num%’;
- pipeline是否开启:show variables like ‘%pipeline%’;
- be节点cpu和内存使用率截图
- 查询报错:
- query_dump,怎么获取query_dump文件
- be crash
- be.out
- coredump,如何获取coredump
- 外表查询报错
- be.out和fe.warn.log
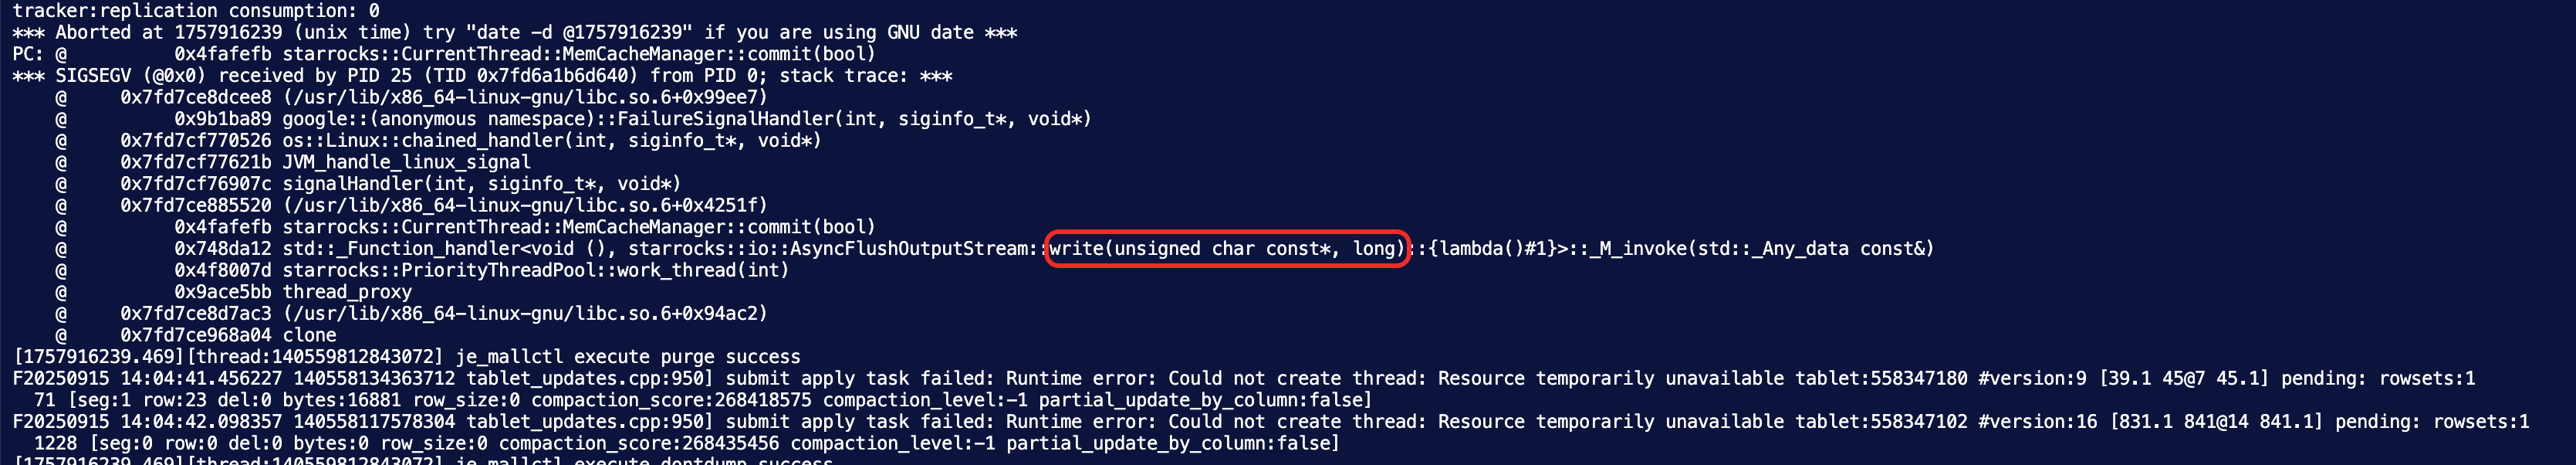 这次的这个是write导致的