
【详述】
- 建表语句
CREATE TABLE test (
  store_id varchar(20) NULL ,
  client_id varchar(20) NULL ,
  item_id varchar(20) NULL,
  item_name varchar(500) NULL ,
  detail_addcart_uv int(11) NULL,
  dt date NOT NULL
) ENGINE=OLAP
DUPLICATE KEY(store_id, client_id)
COMMENT ""
PARTITION BY RANGE(dt)
(
PARTITION p202206 VALUES [("2023-06-01"), ("2023-07-01"))
)
DISTRIBUTED BY HASH(store_id, client_id, item_id) BUCKETS 8
PROPERTIES (
"bloom_filter_columns" = "item_id"
);
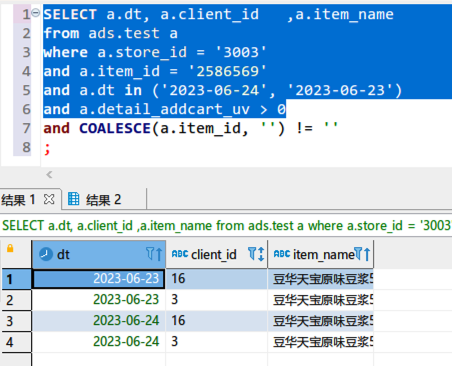
- 查询SQL
select a.dt, a.client_id ,a.item_name
from ads.test a
where a.store_id = '3003'
and a.item_id = '2586569'
and a.dt in ('2023-06-24', '2023-06-23')
and a.detail_addcart_uv > 0
and COALESCE (a.item_id, '') != ''
当SQL中带有and COALESCE (a.item_id, '') != ''条件时,查询无数据,而上述SQL实际查询结果应是下面这样的。
【业务影响】
【StarRocks版本】例如:2.5.6
【集群规模】例如:3fe(1 follower+2observer)+8be(fe与be混部)
【机器信息】CPU虚拟核/内存/网卡,例如:64C/512G/万兆
【附件】