
全表查询速度太慢表,数据 80万数据,全表查询花了22s,比mysql还慢几秒
【背景】 select * from event_door;
【StarRocks版本】例如:2.5.0-rc02
【集群规模】例如:1fe+2be(fe与be混部)
【机器信息】CPU虚拟核/内存/网卡,例如:8C/32G/万兆
【附件】
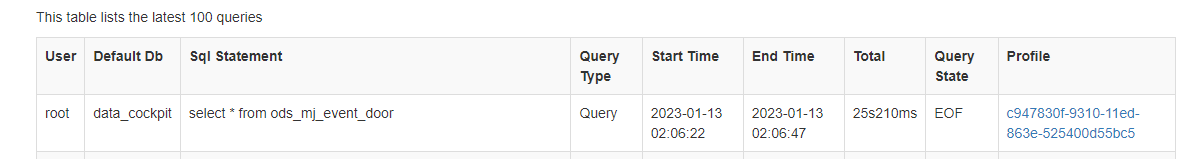
- 慢查询:
-
Profile信息
Query:
Summary:- Query ID: c947830f-9310-11ed-863e-525400d55bc5
- Start Time: 2023-01-13 02:06:22
- End Time: 2023-01-13 02:06:47
- Total: 25s210ms
- Query Type: Query
- Query State: EOF
- StarRocks Version: 2.5.0-RC02-394fb80
- User: root
- Default Db: data_cockpit
- Sql Statement: select * from ods_mj_event_door
- QueryCpuCost: 2s442ms
- QueryMemCost: 120.087MB
- Variables: parallel_fragment_exec_instance_num=8,pipeline_dop=0,enable_adaptive_sink_dop=true
- Collect Profile Time: 3ms
Planner: - Analyzer: 0ms / 1
- CoordDeliverExec: 2ms / 1
- CoordPrepareExec: 0ms / 1
- ExecPlanBuild: 0ms / 1
- Optimizer: 0ms / 1
- Total: 1ms / 1
Optimizer:- CostBaseOptimize: 0ms / 1
- PhysicalRewrite: 0ms / 1
- RuleBaseOptimize: 0ms / 1
Execution Profile c947830f-9310-11ed-863e-525400d55bc5:
- ExecutionTotalTime: 2s814ms
Fragment 0:- BackendAddresses: 192.168.100.147:9060
- BackendNum: 1
- FragmentInstancePrepareTime: 401.341us
- InstanceNum: 1
- PeakMemoryUsage: 120.07 MB
- QueryMemoryLimit: 22.78 GB
Pipeline (id=1):- ActiveTime: 2s441ms
- BlockByInputEmpty: 1
- BlockByOutputFull: 198
- BlockByPrecondition: 0
- DegreeOfParallelism: 1
- DriverPrepareTime: 75.847us
- DriverTotalTime: 25s7ms
- OverheadTime: 8.639ms
- PendingTime: 22s548ms
- InputEmptyTime: 10.23ms
- FirstInputEmptyTime: 343.344us
- FollowupInputEmptyTime: 9.680ms
- OutputFullTime: 22s539ms
- PendingFinishTime: 0ns
- PreconditionBlockTime: 0ns
- InputEmptyTime: 10.23ms
- ScheduleCount: 200
- ScheduleTime: 18.89ms
- TotalDegreeOfParallelism: 1
- YieldByPreempt: 0
- YieldByTimeLimit: 0
RESULT_SINK:
CommonMetrics:- CloseTime: 4.892us
- OperatorTotalTime: 2s429ms
- PeakMemoryUsage: 0.00
- PrepareTime: 20.25us
- PullChunkNum: 0
- PullRowNum: 0
- PullTotalTime: 0ns
- PushChunkNum: 200
- PushRowNum: 816.934K (816934)
- PushTotalTime: 2s429ms
- SetFinishedTime: 49ns
- SetFinishingTime: 279ns
UniqueMetrics:
OLAP_SCAN (plan_node_id=0):
CommonMetrics: - CloseTime: 577.974us
- JoinRuntimeFilterEvaluate: 0
- JoinRuntimeFilterHashTime: 0ns
- JoinRuntimeFilterInputRows: 0
- JoinRuntimeFilterOutputRows: 0
- JoinRuntimeFilterTime: 0ns
- OperatorTotalTime: 3.221ms
- PeakMemoryUsage: 0.00
- PrepareTime: 26.791us
- PullChunkNum: 200
- PullRowNum: 816.934K (816934)
- PullTotalTime: 2.642ms
- PushChunkNum: 0
- PushRowNum: 0
- PushTotalTime: 0ns
- RuntimeBloomFilterNum: 0
- RuntimeInFilterNum: 0
- SetFinishedTime: 209ns
- SetFinishingTime: 765ns
UniqueMetrics: - MorselQueueType: fixed_morsel_queue
- BufferUnplugThreshold: 32
- SharedScan: False
- Rollup: ods_mj_event_door
- Table: ods_mj_event_door
- BufferUnplugCount: 1
- BytesRead: 221.96 MB
- CachedPagesNum: 1
- ChunkBufferCapacity: 64
- CompressedBytesRead: 56.26 MB
- CreateSegmentIter: 88.72us
- DefaultChunkBufferCapacity: 64
- GetDelVec: 3.649us
- GetRowsets: 786ns
- IOTaskExecTime: 381.696ms
- IOTaskWaitTime: 395.865us
- IOTime: 29.663ms
- MorselsCount: 1
- PeakChunkBufferSize: 64
- PushdownPredicates: 0
- RawRowsRead: 816.934K (816934)
- ReadPagesNum: 2.642K (2642)
- RowsRead: 816.934K (816934)
- ScanTime: 382.92ms
- SegmentInit: 1.453ms
- BitmapIndexFilter: 0ns
- BitmapIndexFilterRows: 0
- BloomFilterFilterRows: 0
- SegmentRuntimeZoneMapFilterRows: 0
- SegmentZoneMapFilterRows: 0
- ShortKeyFilterRows: 0
- ZoneMapIndexFilterRows: 0
- SegmentRead: 363.863ms
- BlockFetch: 355.757ms
- BlockFetchCount: 200
- BlockSeek: 6.908ms
- BlockSeekCount: 2.596K (2596)
- ChunkCopy: 0ns
- DecompressT: 3.178ms
- DelVecFilterRows: 0
- IndexLoad: 0ns
- PredFilter: 0ns
- PredFilterRows: 0
- RowsetsReadCount: 1
- SegmentsReadCount: 1
- TotalColumnsDataPageCount: 2.634K (2634)
- SubmitTaskCount: 6
- TabletCount: 1
- UncompressedBytesRead: 57.55 MB
Pipeline (id=0):
- ActiveTime: 103.866us
- BlockByInputEmpty: 0
- BlockByOutputFull: 0
- BlockByPrecondition: 0
- DegreeOfParallelism: 1
- DriverPrepareTime: 77.736us
- DriverTotalTime: 379.598us
- OverheadTime: 0ns
- PendingTime: 0ns
- InputEmptyTime: 0ns
- FirstInputEmptyTime: 0ns
- FollowupInputEmptyTime: 0ns
- OutputFullTime: 0ns
- PendingFinishTime: 0ns
- PreconditionBlockTime: 0ns
- InputEmptyTime: 0ns
- ScheduleCount: 1
- ScheduleTime: 275.732us
- TotalDegreeOfParallelism: 1
- YieldByPreempt: 0
- YieldByTimeLimit: 0
NOOP_SINK (plan_node_id=0):
CommonMetrics:- CloseTime: 244ns
- OperatorTotalTime: 484ns
- PeakMemoryUsage: 0.00
- PrepareTime: 16.386us
- PullChunkNum: 0
- PullRowNum: 0
- PullTotalTime: 0ns
- PushChunkNum: 0
- PushRowNum: 0
- PushTotalTime: 0ns
- SetFinishedTime: 59ns
- SetFinishingTime: 181ns
UniqueMetrics:
OLAP_SCAN_PREPARE (plan_node_id=0):
CommonMetrics: - CloseTime: 6.957us
- OperatorTotalTime: 104.696us
- PeakMemoryUsage: 0.00
- PrepareTime: 24.487us
- PullChunkNum: 0
- PullRowNum: 0
- PullTotalTime: 97.422us
- PushChunkNum: 0
- PushRowNum: 0
- PushTotalTime: 0ns
- RuntimeBloomFilterNum: 0
- RuntimeInFilterNum: 0
- SetFinishedTime: 136ns
- SetFinishingTime: 181ns
UniqueMetrics:
-
并行度:show variables like ‘%parallel_fragment_exec_instance_num%’;
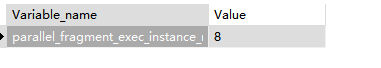
-
pipeline是否开启:show variables like ‘%pipeline%’;
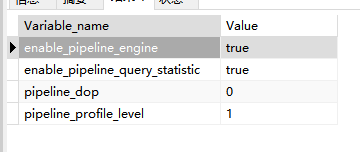
-
说明:领导让我测试一下starrocks的性能,在考虑投入报表使用中,由于只有80万条数据,

Datasize只有56M,所以只分了一个桶,除此之外也使用了分桶计算公式8(2be*8/2),但是速度也是一样,非常慢,求解我是哪配错了吗?