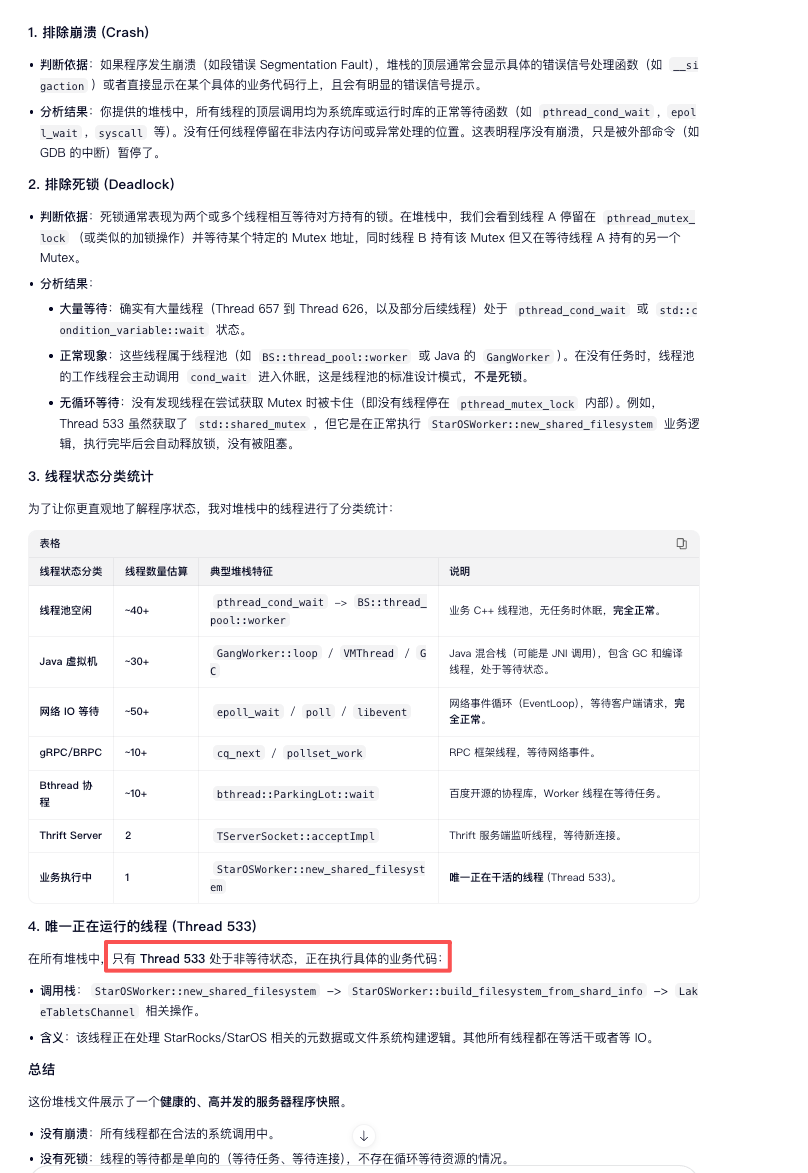
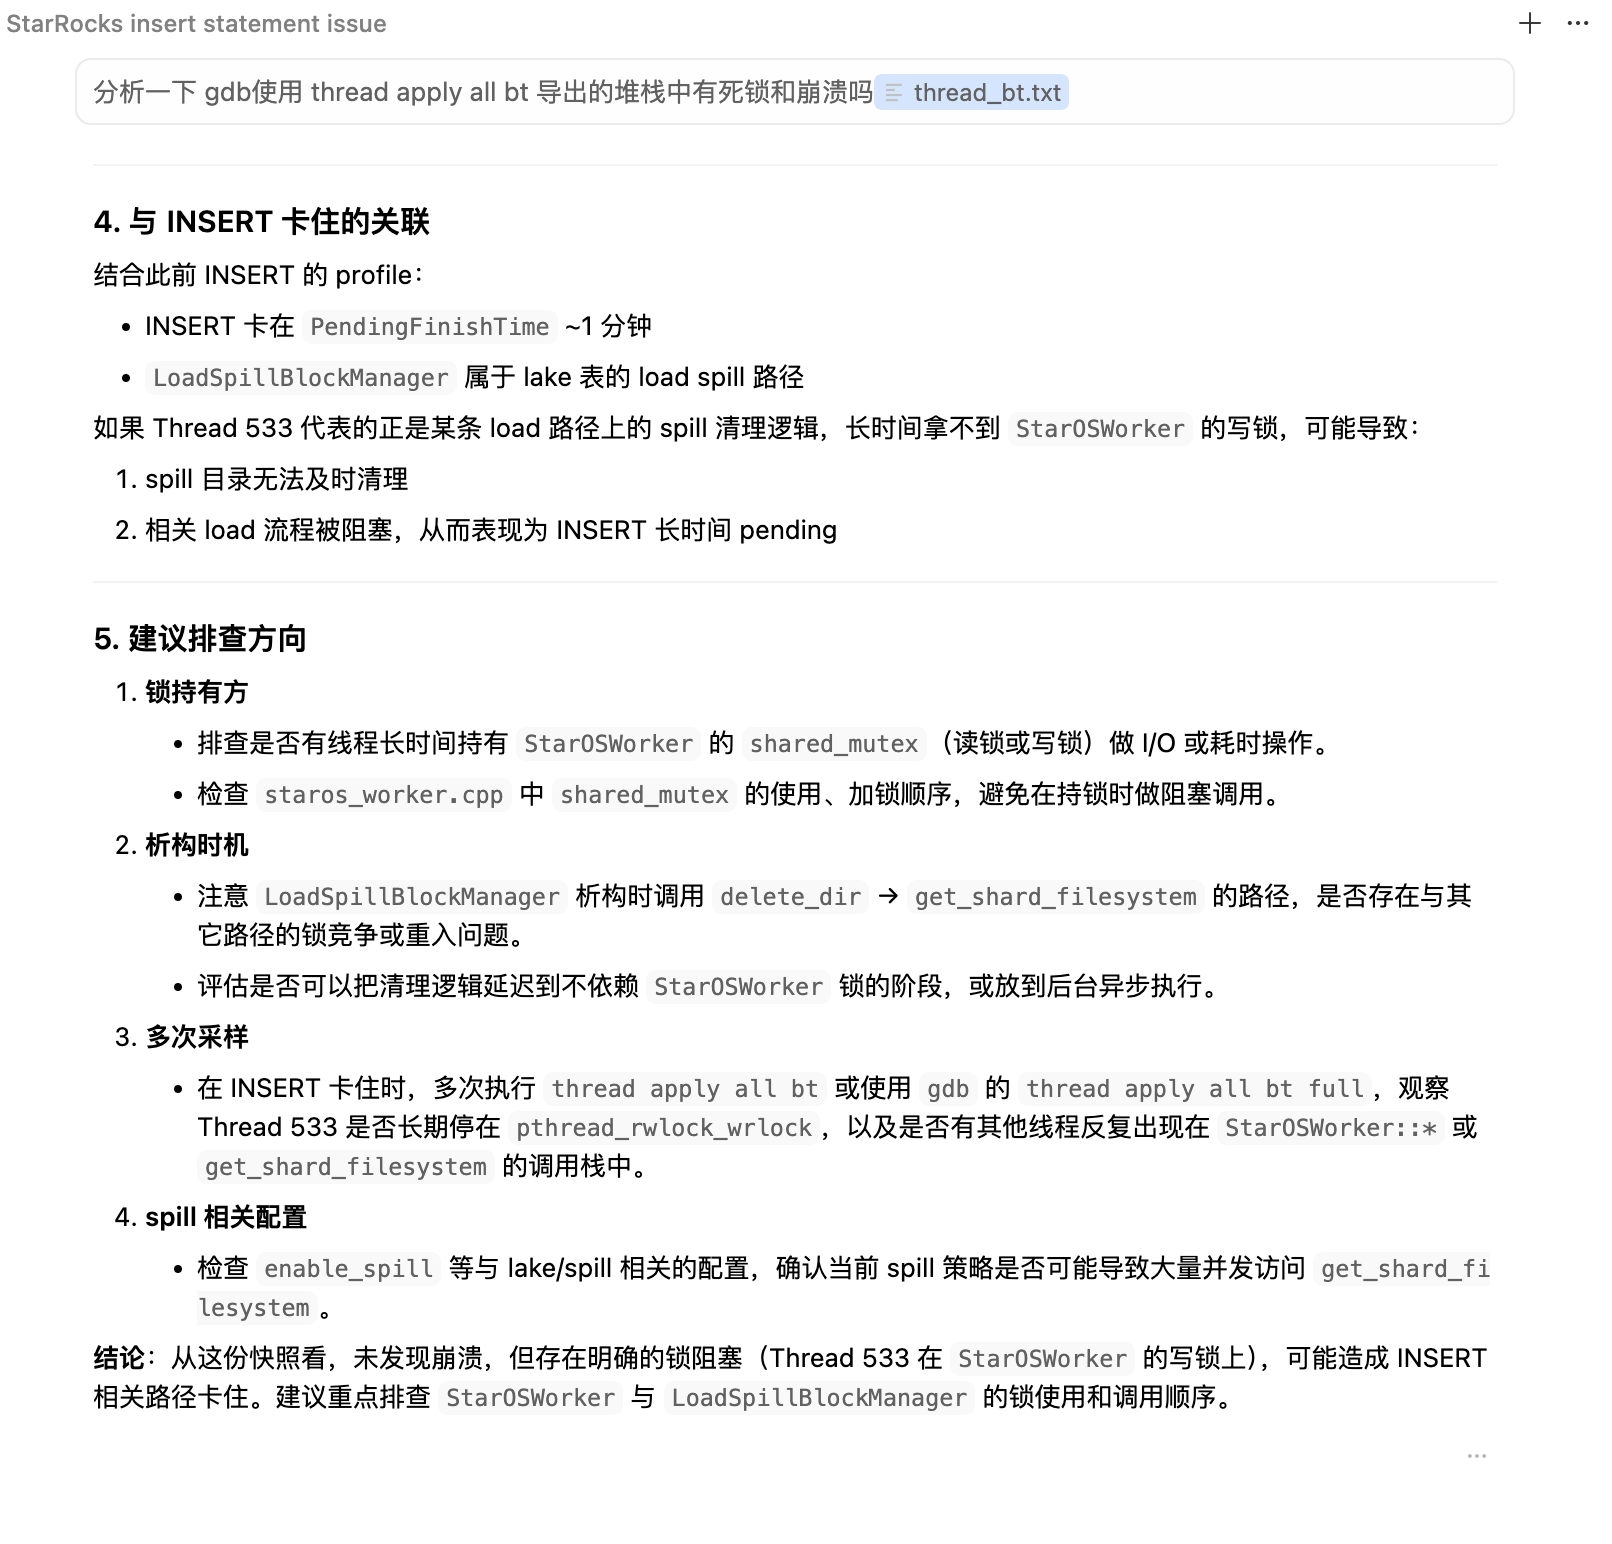
好像语法不对
admin execute on    10049926;

[2026-03-16 17:27:15] [42000][1064] Getting syntax error at line 1, column 68. Detail message: Unexpected input ';', the most similar input is {SINGLE_QUOTED_TEXT, DOUBLE_QUOTED_TEXT}.


admin execute on    '10049926';

[2026-03-16 17:27:55] [42000][1064] Getting syntax error at line 1, column 60. Detail message: Unexpected input ''10049926'', the most similar input is {'FRONTEND', INTEGER_VALUE}.

# 执行下面的 sql 返回空结果
admin execute on  FRONTEND  '10049926';
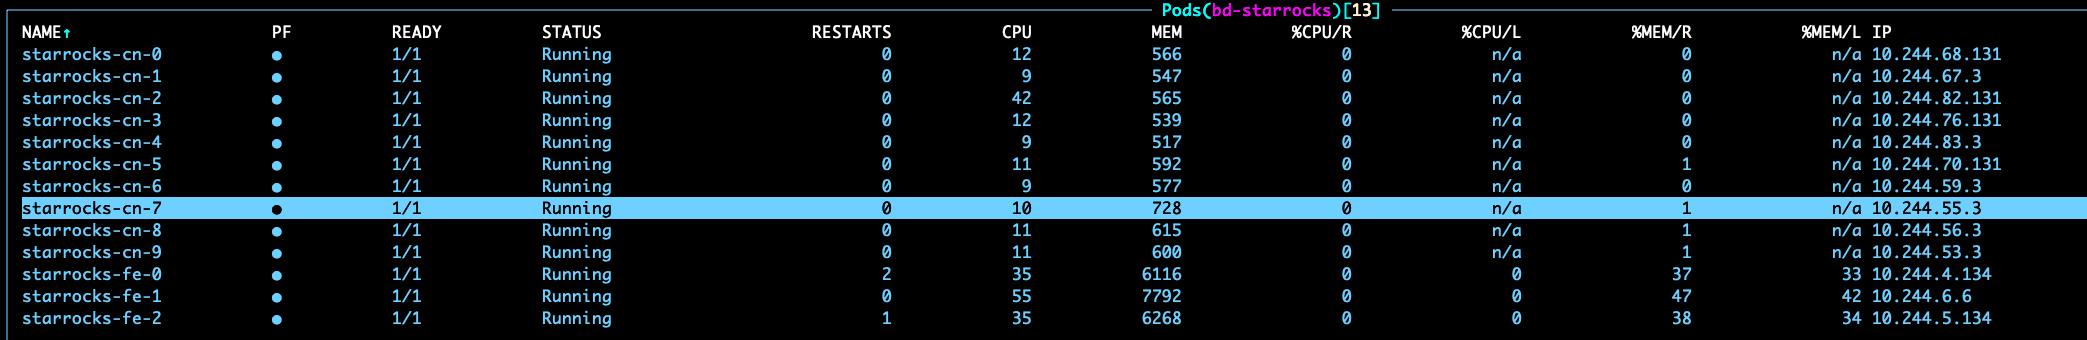
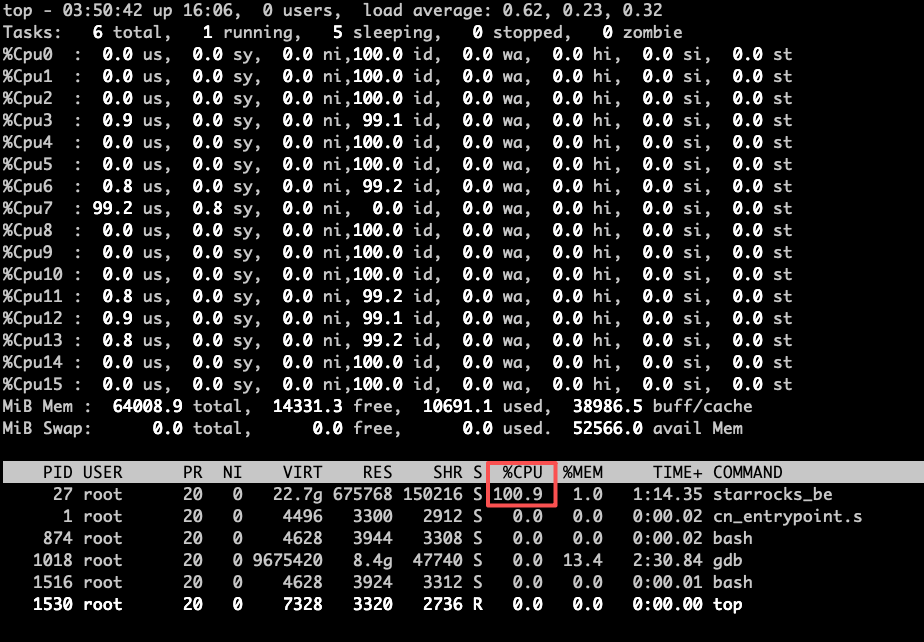
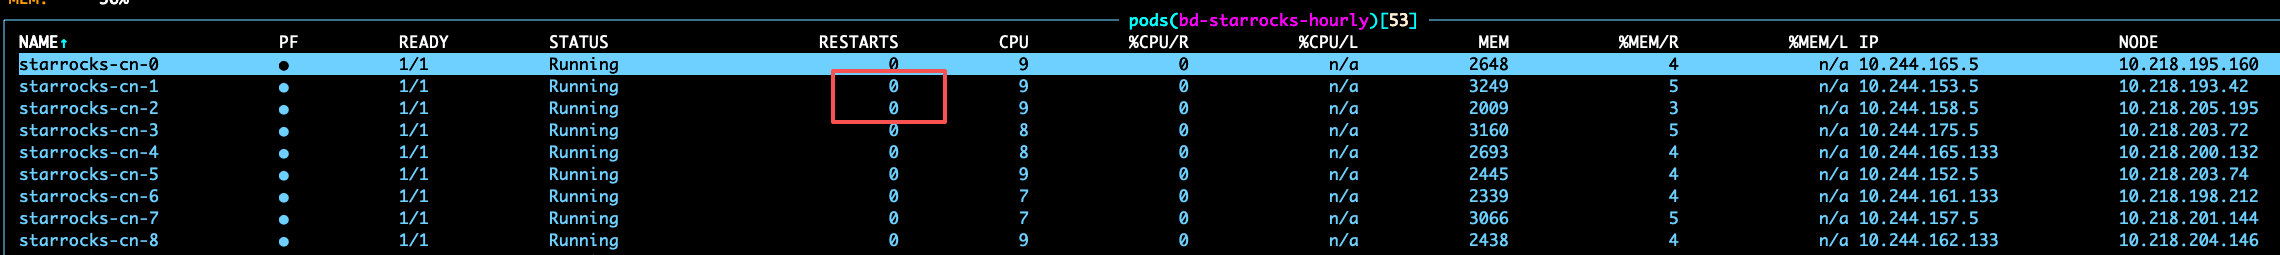
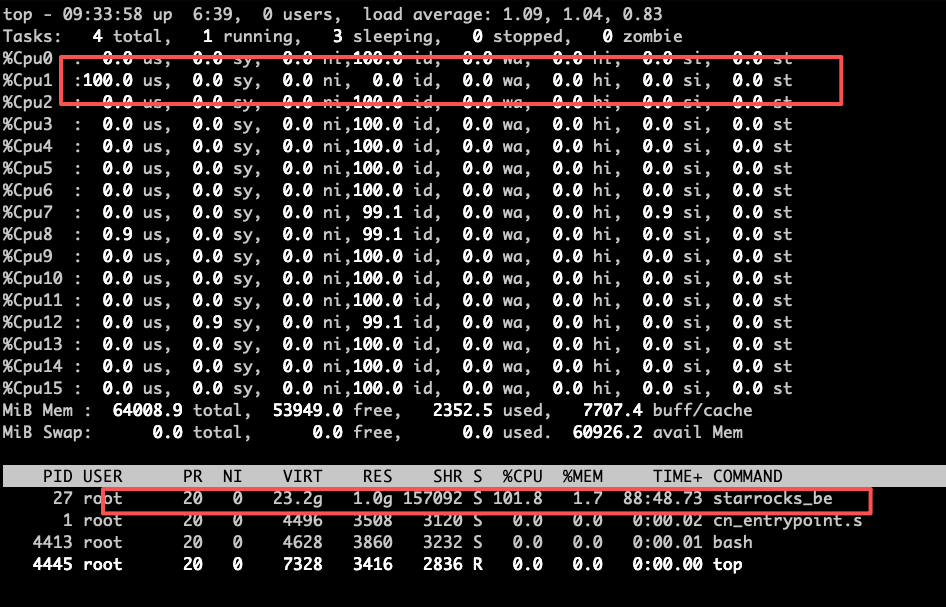
另外执行插入语句后, 查看监控如图
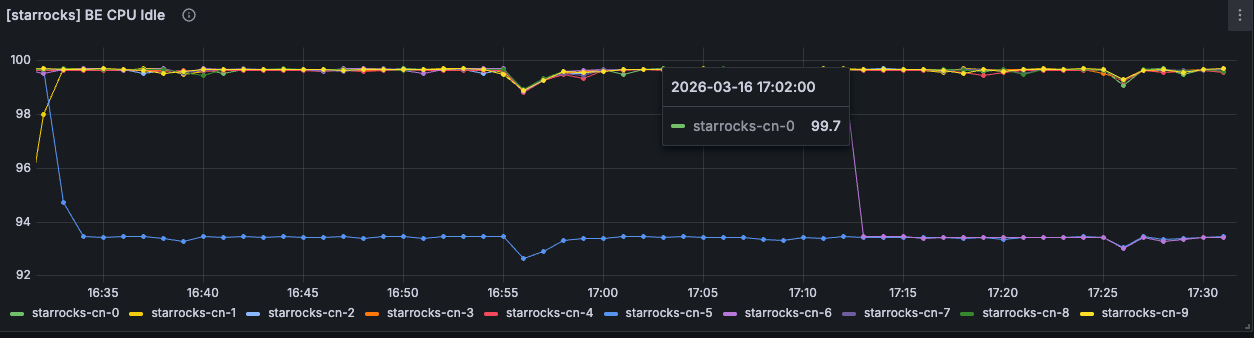
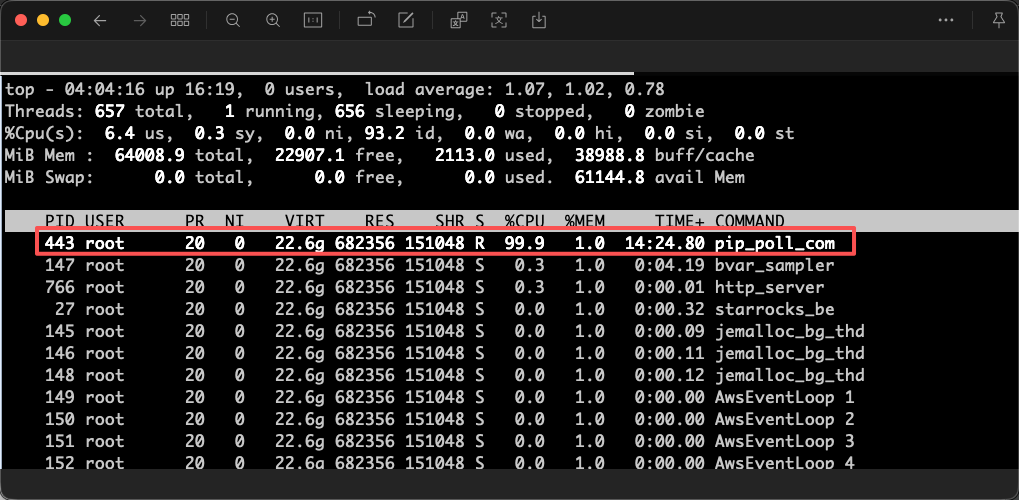
蓝色的是 statistics 语句卡主后, 一台 cn 5 节点 CPU 使用比其他的高一些, 16核CPU, 有一核一直是 100%
在没有重启 FE 的情况下,再次执行插入语句(新分区), 紫色的线是 cn6节点开始出现跟 cn5 一样的情况
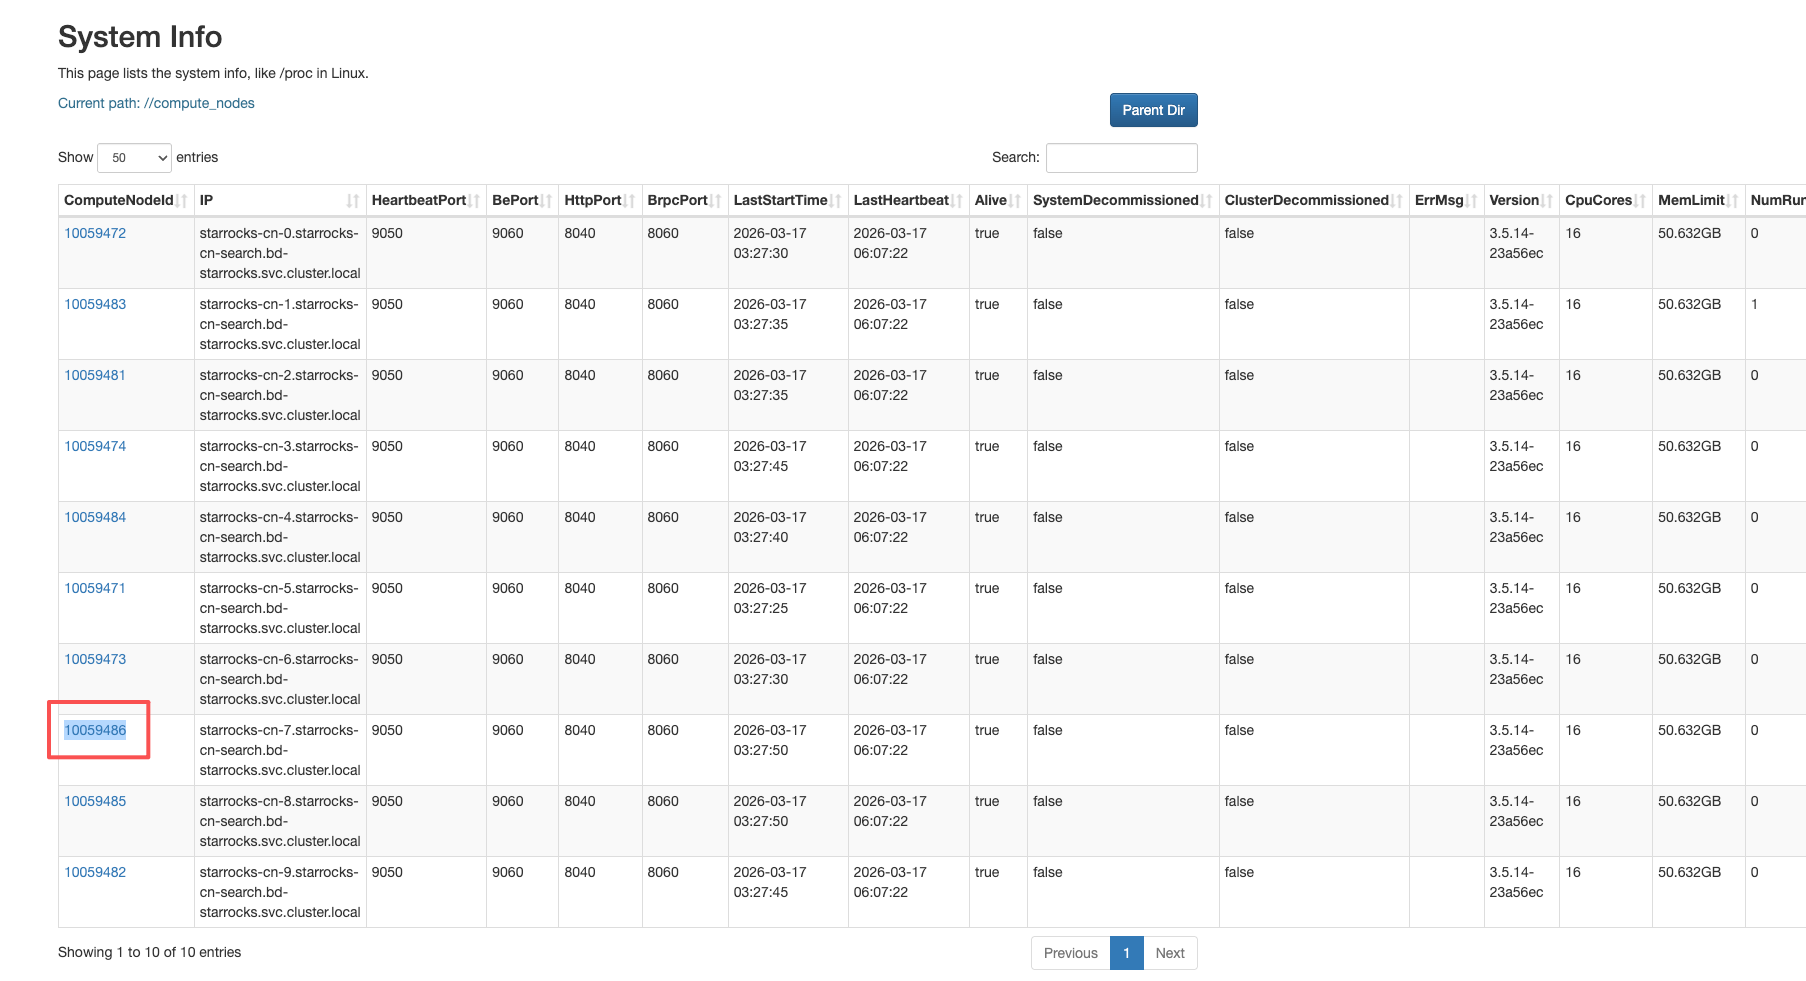
此时看 ui页面

17点 12 分执行的插入, 紫色线对应的 cn6 节点的 info 日志
datacache(0) jit(0) replication(0) jemalloc_active(689999872) jemalloc_allocated(591843008) jemalloc_metadata(43393072) jemalloc_rss(719454208)
I20260316 09:11:17.495351 140026856908352 starlet.cc:155] Report worker state to 'starrocks-fe-2.starrocks-fe-search.bd-starrocks.svc.cluster.local:6090', counter:1369
I20260316 09:11:29.430142 140031469549120 daemon.cpp:140] Current memory statistics: process(461680128) query_pool(-188219080) load(2338912) metadata(65995) compaction(0) schema_change(0) page_cache(28093) update(0) passthrough(0) clone(0) consistency(0)
datacache(0) jit(0) replication(0) jemalloc_active(690061312) jemalloc_allocated(591877512) jemalloc_metadata(43393072) jemalloc_rss(721580032)
I20260316 09:11:44.432809 140031469549120 daemon.cpp:140] Current memory statistics: process(461680128) query_pool(-188219080) load(2338912) metadata(65995) compaction(0) schema_change(0) page_cache(28093) update(0) passthrough(0) clone(0) consistency(0)
datacache(0) jit(0) replication(0) jemalloc_active(690233344) jemalloc_allocated(592038672) jemalloc_metadata(43393072) jemalloc_rss(720179200)
I20260316 09:11:52.080756 140029449668160 tablet_sink_sender.cpp:353] Olap table sink statistics. load_id: 2ba7b9c6-2118-11f1-97a5-0afbe4ba4d88, txn_id: 1620448, add chunk time(ms)/wait lock time(ms)/num: {10049926:(0)(0)(1)} {10049882:(0)(0)(1)}
I20260316 09:11:52.085995 140029449668160 tablet_sink_sender.cpp:353] Olap table sink statistics. load_id: 2ba7b9c6-2118-11f1-97a5-0afbe4ba4d88, txn_id: 1620448, add chunk time(ms)/wait lock time(ms)/num: {10049926:(0)(0)(1)} {10049882:(0)(0)(1)}
I20260316 09:11:52.091071 140029449668160 tablet_sink_sender.cpp:353] Olap table sink statistics. load_id: 2ba7b9c6-2118-11f1-97a5-0afbe4ba4d88, txn_id: 1620448, add chunk time(ms)/wait lock time(ms)/num: {10049926:(0)(0)(1)} {10049882:(0)(0)(1)}
I20260316 09:11:52.096159 140029449668160 tablet_sink_sender.cpp:353] Olap table sink statistics. load_id: 2ba7b9c6-2118-11f1-97a5-0afbe4ba4d88, txn_id: 1620448, add chunk time(ms)/wait lock time(ms)/num: {10049926:(0)(0)(1)} {10049882:(0)(0)(1)}
I20260316 09:11:58.132295 140027149076032 olap_server.cpp:895] begin to do tablet meta checkpoint:/opt/starrocks/cn/storage/root
I20260316 09:11:59.435237 140031469549120 daemon.cpp:140] Current memory statistics: process(465250896) query_pool(-185587104) load(2346928) metadata(65995) compaction(0) schema_change(0) page_cache(28093) update(0) passthrough(0) clone(0) consistency(0)
datacache(0) jit(0) replication(0) jemalloc_active(692658176) jemalloc_allocated(595156552) jemalloc_metadata(43479088) jemalloc_rss(724107264)
I20260316 09:12:13.394883 140022833735232 heartbeat_server.cpp:78] get heartbeat from FE. host:starrocks-fe-2.starrocks-fe-search.bd-starrocks.svc.cluster.local, port:9020, cluster id:787941996, node type:1, run_mode:SHARED_DATA, counter:2761
I20260316 09:12:14.437647 140031469549120 daemon.cpp:140] Current memory statistics: process(465222560) query_pool(-185587104) load(2346928) metadata(65995) compaction(0) schema_change(0) page_cache(28093) update(0) passthrough(0) clone(0) consistency(0)
datacache(0) jit(0) replication(0) jemalloc_active(692555776) jemalloc_allocated(594838880) jemalloc_metadata(43421744) jemalloc_rss(722432000)
I20260316 09:12:29.440213 140031469549120 daemon.cpp:140] Current memory statistics: process(465290224) query_pool(-185586800) load(2346928) metadata(65995) compaction(0) schema_change(0) page_cache(28093) update(0) passthrough(0) clone(0) consistency(0)
datacache(0) jit(0) replication(0) jemalloc_active(691990528) jemalloc_allocated(594365280) jemalloc_metadata(43421744) jemalloc_rss(723972096)
I20260316 09:12:44.442595 140031469549120 daemon.cpp:140] Current memory statistics: process(465290384) query_pool(-185586800) load(2346928) metadata(65995) compaction(0) schema_change(0) page_cache(28093) update(0) passthrough(0) clone(0) consistency(0)
datacache(0) jit(0) replication(0) jemalloc_active(692043776) jemalloc_allocated(594406800) jemalloc_metadata(43421744) jemalloc_rss(721969152)
I20260316 09:12:58.131647 140027316930112 update_manager.cpp:442] index cache expire: before:(0 0) after:(0 0) expire: (0 0)
I20260316 09:12:58.131665 140027316930112 update_manager.cpp:810] update state cache expire: (0 0), index cache expire: (0 0), compaction cache expire: (0 0)
I20260316 09:12:59.445229 140031469549120 daemon.cpp:140] Current memory statistics: process(465346944) query_pool(-185585984) load(2346928) metadata(65995) compaction(0) schema_change(0) page_cache(28093) update(0) passthrough(0) clone(0) consistency(0)
datacache(0) jit(0) replication(0) jemalloc_active(691884032) jemalloc_allocated(594247200) jemalloc_metadata(43421744) jemalloc_rss(723787776)
I20260316 09:13:13.395015 140022833735232 heartbeat_server.cpp:78] get heartbeat from FE. host:starrocks-fe-2.starrocks-fe-search.bd-starrocks.svc.cluster.local, port:9020, cluster id:787941996, node type:1, run_mode:SHARED_DATA, counter:2773
I20260316 09:13:14.447726 140031469549120 daemon.cpp:140] Current memory statistics: process(465346496) query_pool(-185585984) load(2346928) metadata(65995) compaction(0) schema_change(0) page_cache(28093) update(0) passthrough(0) clone(0) consistency(0)
datacache(0) jit(0) replication(0) jemalloc_active(691920896) jemalloc_allocated(594246736) jemalloc_metadata(43421744) jemalloc_rss(721874944)
I20260316 09:13:15.068685 140027417642560 lake_service.cpp:961] Ignored duplicate vacuum request of partition 10051126
I20260316 09:13:15.068708 140027417642560 lake_service.cpp:961] Ignored duplicate vacuum request of partition 10049887
I20260316 09:13:15.068775 140026675418688 lake_service.cpp:961] Ignored duplicate vacuum request of partition 10035082
I20260316 09:13:17.070131 140026772981312 lake_service.cpp:961] Ignored duplicate vacuum request of partition 10054114
I20260316 09:13:17.070159 140026772981312 lake_service.cpp:961] Ignored duplicate vacuum request of partition 10051135
I20260316 09:13:17.070175 140027426035264 lake_service.cpp:961] Ignored duplicate vacuum request of partition 10054107
I20260316 09:13:17.070212 140027375679040 lake_service.cpp:961] Ignored duplicate vacuum request of partition 10049950
I20260316 09:13:17.931167 140026856908352 starlet.cc:155] Report worker state to 'starrocks-fe-2.starrocks-fe-search.bd-starrocks.svc.cluster.local:6090', counter:1381
I20260316 09:13:29.450454 140031469549120 daemon.cpp:140] Current memory statistics: process(465417328) query_pool(-185585680) load(2346928) metadata(65995) compaction(0) schema_change(0) page_cache(28093) update(0) passthrough(0) clone(0) consistency(0)
datacache(0) jit(0) replication(0) jemalloc_active(691884032) jemalloc_allocated(594297128) jemalloc_metadata(43421744) jemalloc_rss(724140032)
I20260316 09:13:44.452941 140031469549120 daemon.cpp:140] Current memory statistics: process(465417488) query_pool(-185585680) load(2346928) metadata(65995) compaction(0) schema_change(0) page_cache(28093) update(0) passthrough(0) clone(0) consistency(0)
datacache(0) jit(0) replication(0) jemalloc_active(691908608) jemalloc_allocated(594296464) jemalloc_metadata(43421744) jemalloc_rss(721858560)
I20260316 09:13:59.455554 140031469549120 daemon.cpp:140] Current memory statistics: process(465481488) query_pool(-185585376) load(2346928) metadata(65995) compaction(0) schema_change(0) page_cache(28093) update(0) passthrough(0) clone(0) consistency(0)
datacache(0) jit(0) replication(0) jemalloc_active(691699712) jemalloc_allocated(594083288) jemalloc_metadata(43421744) jemalloc_rss(723742720)
I20260316 09:14:13.395607 140022833735232 heartbeat_server.cpp:78] get heartbeat from FE. host:starrocks-fe-2.starrocks-fe-search.bd-starrocks.svc.cluster.local, port:9020, cluster id:787941996, node type:1, run_mode:SHARED_DATA, counter:2785
I20260316 09:14:14.457775 140031469549120 daemon.cpp:140] Current memory statistics: process(465481488) query_pool(-185585376) load(2346928) metadata(65995) compaction(0) schema_change(0) page_cache(28093) update(0) passthrough(0) clone(0) consistency(0)
datacache(0) jit(0) replication(0) jemalloc_active(691720192) jemalloc_allocated(594094048) jemalloc_metadata(43421744) jemalloc_rss(721911808)
I20260316 09:14:29.460397 140031469549120 daemon.cpp:140] Current memory statistics: process(465549696) query_pool(-185585072) load(2346928) metadata(65995) compaction(0) schema_change(0) page_cache(28093) update(0) passthrough(0) clone(0) consistency(0)
datacache(0) jit(0) replication(0) jemalloc_active(691765248) jemalloc_allocated(594101832) jemalloc_metadata(43421744) jemalloc_rss(723161088)
I20260316 09:14:44.462694 140031469549120 daemon.cpp:140] Current memory statistics: process(465549696) query_pool(-185585072) load(2346928) metadata(65995) compaction(0) schema_change(0) page_cache(28093) update(0) passthrough(0) clone(0) consistency(0)
datacache(0) jit(0) replication(0) jemalloc_active(691609600) jemalloc_allocated(593973072) jemalloc_metadata(43421744) jemalloc_rss(721723392)
I20260316 09:14:59.465058 140031469549120 daemon.cpp:140] Current memory statistics: process(465611712) query_pool(-185584768) load(2346928) metadata(65995) compaction(0) schema_change(0) page_cache(28093) update(0) passthrough(0) clone(0) consistency(0)
datacache(0) jit(0) replication(0) jemalloc_active(691671040) jemalloc_allocated(594058144) jemalloc_metadata(43421744) jemalloc_rss(723587072)
I20260316 09:15:13.395633 140022833735232 heartbeat_server.cpp:78] get heartbeat from FE. host:starrocks-fe-2.starrocks-fe-search.bd-starrocks.svc.cluster.local, port:9020, cluster id:787941996, node type:1, run_mode:SHARED_DATA, counter:2797
I20260316 09:15:14.467298 140031469549120 daemon.cpp:140] Current memory statistics: process(465612192) query_pool(-185584768) load(2346928) metadata(65995) compaction(0) schema_change(0) page_cache(28093) update(0) passthrough(0) clone(0) consistency(0)
datacache(0) jit(0) replication(0) jemalloc_active(691720192) jemalloc_allocated(594086112) jemalloc_metadata(43421744) jemalloc_rss(721846272)
I20260316 09:15:18.347867 140026856908352 starlet.cc:155] Report worker state to 'starrocks-fe-2.starrocks-fe-search.bd-starrocks.svc.cluster.local:6090', counter:1393
I20260316 09:15:29.469951 140031469549120 daemon.cpp:140] Current memory statistics: process(465680464) query_pool(-185584464) load(2346928) metadata(65995) compaction(0) schema_change(0) page_cache(28093) update(0) passthrough(0) clone(0) consistency(0)
datacache(0) jit(0) replication(0) jemalloc_active(691535872) jemalloc_allocated(593813856) jemalloc_metadata(43421744) jemalloc_rss(723324928)
I20260316 09:15:44.472317 140031469549120 daemon.cpp:140] Current memory statistics: process(465680624) query_pool(-185584464) load(2346928) metadata(65995) compaction(0) schema_change(0) page_cache(28093) update(0) passthrough(0) clone(0) consistency(0)
datacache(0) jit(0) replication(0) jemalloc_active(691380224) jemalloc_allocated(593694352) jemalloc_metadata(43421744) jemalloc_rss(721272832)
I20260316 09:15:59.474776 140031469549120 daemon.cpp:140] Current memory statistics: process(465728160) query_pool(-185584160) load(2346928) metadata(65995) compaction(0) schema_change(0) page_cache(28093) update(0) passthrough(0) clone(0) consistency(0)
datacache(0) jit(0) replication(0) jemalloc_active(690876416) jemalloc_allocated(593314296) jemalloc_metadata(43421744) jemalloc_rss(722923520)
cn6的 warning日志如下
W20260316 06:29:08.260980 140029337417280 tablet_sink_sender.cpp:299] close channel failed. channel_name=NodeChannel[10049871], load_info=load_id=0e29c5ea-20f9-11f1-a0b7-7655ac8707e6, txn_id: 1619073, parallel=1, compress_type=2, error_msg=Cancelled by pipeline engine, reason: Cancelled: Query reached its timeout of 3600 seconds
W20260316 06:29:08.261026 140029337417280 tablet_sink_sender.cpp:299] close channel failed. channel_name=NodeChannel[10049882], load_info=load_id=0e29c5ea-20f9-11f1-a0b7-7655ac8707e6, txn_id: 1619073, parallel=1, compress_type=2, error_msg=Cancelled by pipeline engine, reason: Cancelled: Query reached its timeout of 3600 seconds
W20260316 06:29:08.260969 140029382526528 tablet_sink_sender.cpp:299] close channel failed. channel_name=NodeChannel[10049871], load_info=load_id=0e29c5ea-20f9-11f1-a0b7-7655ac8707e6, txn_id: 1619073, parallel=1, compress_type=2, error_msg=Cancelled by pipeline engine, reason: Cancelled: Query reached its timeout of 3600 seconds
W20260316 06:29:08.261041 140029382526528 tablet_sink_sender.cpp:299] close channel failed. channel_name=NodeChannel[10049882], load_info=load_id=0e29c5ea-20f9-11f1-a0b7-7655ac8707e6, txn_id: 1619073, parallel=1, compress_type=2, error_msg=Cancelled by pipeline engine, reason: Cancelled: Query reached its timeout of 3600 seconds
W20260316 06:29:08.261019 140029424490048 tablet_sink_sender.cpp:299] close channel failed. channel_name=NodeChannel[10049885], load_info=load_id=0e29c5ea-20f9-11f1-a0b7-7655ac8707e6, txn_id: 1619073, parallel=1, compress_type=2, error_msg=Cancelled by pipeline engine, reason: Cancelled: Query reached its timeout of 3600 seconds
W20260316 06:29:08.261075 140029424490048 tablet_sink_sender.cpp:299] close channel failed. channel_name=NodeChannel[10049872], load_info=load_id=0e29c5ea-20f9-11f1-a0b7-7655ac8707e6, txn_id: 1619073, parallel=1, compress_type=2, error_msg=Cancelled by pipeline engine, reason: Cancelled: Query reached its timeout of 3600 seconds
W20260316 06:29:08.261082 140029424490048 tablet_sink_sender.cpp:299] close channel failed. channel_name=NodeChannel[10049873], load_info=load_id=0e29c5ea-20f9-11f1-a0b7-7655ac8707e6, txn_id: 1619073, parallel=1, compress_type=2, error_msg=Cancelled by pipeline engine, reason: Cancelled: Query reached its timeout of 3600 seconds
W20260316 06:29:08.261089 140029424490048 tablet_sink_sender.cpp:299] close channel failed. channel_name=NodeChannel[10049871], load_info=load_id=0e29c5ea-20f9-11f1-a0b7-7655ac8707e6, txn_id: 1619073, parallel=1, compress_type=2, error_msg=Cancelled by pipeline engine, reason: Cancelled: Query reached its timeout of 3600 seconds
W20260316 06:29:08.261096 140029424490048 tablet_sink_sender.cpp:299] close channel failed. channel_name=NodeChannel[10049882], load_info=load_id=0e29c5ea-20f9-11f1-a0b7-7655ac8707e6, txn_id: 1619073, parallel=1, compress_type=2, error_msg=Cancelled by pipeline engine, reason: Cancelled: Query reached its timeout of 3600 seconds
W20260316 06:29:16.070140 140029776983616 fragment_context.cpp:200] [Driver] Canceled, query_id=12c82d38-20f9-11f1-97a5-0afbe4ba4d88, instance_id=12c82d38-20f9-11f1-97a5-0afbe4ba4d90, reason=Query reached its timeout of 3600 seconds, please increase the 'query_timeout' session variable and retry
W20260316 06:29:16.070488 140029776983616 fragment_context.cpp:200] [Driver] Canceled, query_id=12c82d38-20f9-11f1-97a5-0afbe4ba4d88, instance_id=12c82d38-20f9-11f1-97a5-0afbe4ba4d95, reason=Query reached its timeout of 3600 seconds, please increase the 'query_timeout' session variable and retry
W20260316 06:29:16.072663 140029743412800 fragment_context.cpp:200] [Driver] Canceled, query_id=12c82d38-20f9-11f1-97a5-0afbe4ba4d88, instance_id=12c82d38-20f9-11f1-97a5-0afbe4ba4da7, reason=Query reached its timeout of 3600 seconds, please increase the 'query_timeout' session variable and retry
W20260316 07:28:09.758199 140029329024576 recorder.h:254] Input=2147483647 to `rpc_server_8060_starrocks_pinternal_service_fetch_data' overflows
W20260316 07:30:08.283923 140029751805504 fragment_context.cpp:200] [Driver] Canceled, query_id=93be44c6-2101-11f1-a0b7-7655ac8707e6, instance_id=93be44c6-2101-11f1-a0b7-7655ac8707f0, reason=Query reached its timeout of 3600 seconds
W20260316 08:28:09.769066 140029407704640 recorder.h:254] Input=2147483647 to `rpc_server_8060_starrocks_pinternal_service_fetch_data' overflows
W20260316 08:31:08.317721 140029802161728 fragment_context.cpp:200] [Driver] Canceled, query_id=194b2289-210a-11f1-a0b7-7655ac8707e6, instance_id=194b2289-210a-11f1-a0b7-7655ac8707f0, reason=Query reached its timeout of 3600 seconds
W20260316 09:28:09.779429 140029407704640 recorder.h:254] Input=2147483647 to `rpc_server_8060_starrocks_pinternal_service_fetch_data' overflows
W20260316 09:32:08.349180 140029776983616 fragment_context.cpp:200] [Driver] Canceled, query_id=9ed7da0f-2112-11f1-a0b7-7655ac8707e6, instance_id=9ed7da0f-2112-11f1-a0b7-7655ac8707f0, reason=Query reached its timeout of 3600 seconds
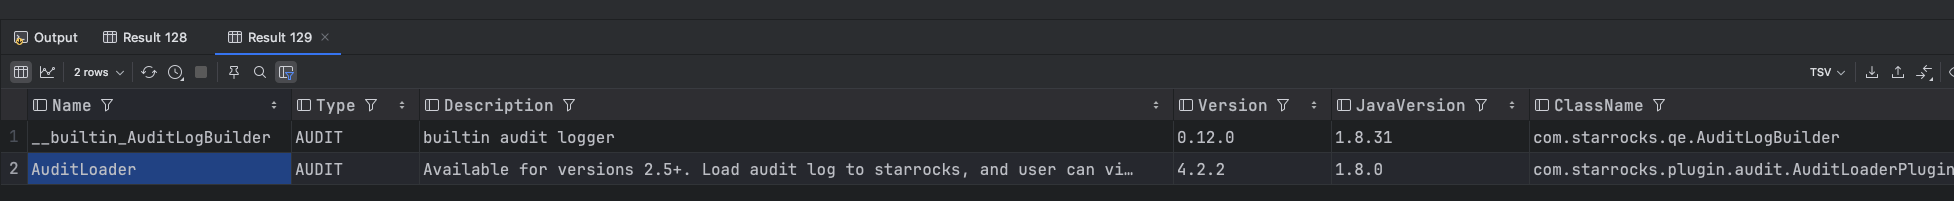
日志里面显示的 3600 秒超时, 是那个 statistics 失败了,此时看 ui, 发现重新生成了一个 statistics 语句
另外我在 fe 的配置文件中增加了禁止 statistics 的配置, 并验证了确实已经生效
    enable_statistic_collect = false
    enable_collect_full_statistic = false
    statistic_auto_analyze_end_time = '00:00:01'

## 通过 sql查看这些配置已经与配置文件中一致
ADMIN SHOW FRONTEND CONFIG LIKE "enable_statistic_collect";
-- enable_statistic_collect	[]	false	boolean	true

ADMIN SHOW FRONTEND CONFIG LIKE "enable_collect_full_statistic";
-- enable_collect_full_statistic	[]	false	boolean	true


ADMIN SHOW FRONTEND CONFIG LIKE "statistic_auto_analyze_start_time";
-- statistic_auto_analyze_start_time	[]	00:00:00	String	true

ADMIN SHOW FRONTEND CONFIG LIKE "statistic_auto_analyze_end_time";
-- statistic_auto_analyze_end_time	[]	'00:00:01'	String	true
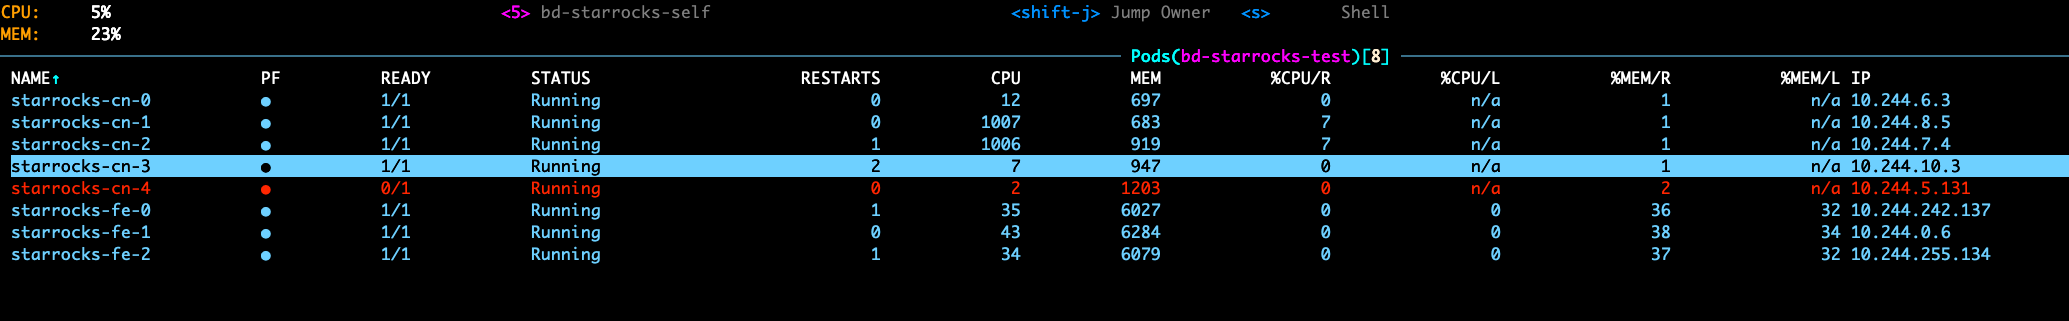
但是 ui 页面中仍然能看到新生成的运行中的 statistics 的查询