存算分离集群,无法新增分区, 无法创建表

【详述】存算分离集群,无法新增分区, 无法创建表
【背景】
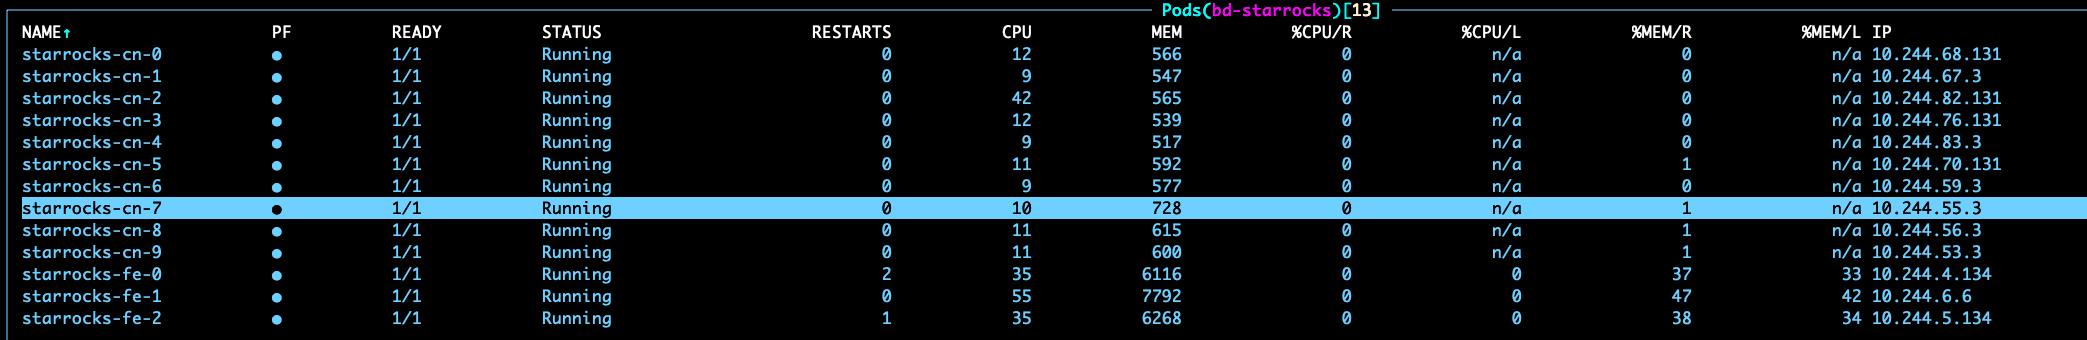
集群中没有 be 节点, 只有 CN 节点,
因为是个给跑批任务用, 每天所有 CN 节点都缩容, 跑任务是再全部开启(10 个 CN)

      场景一:  从 3.3.22 升到 3.4.10 再升到 3.5.13 后发现的问题
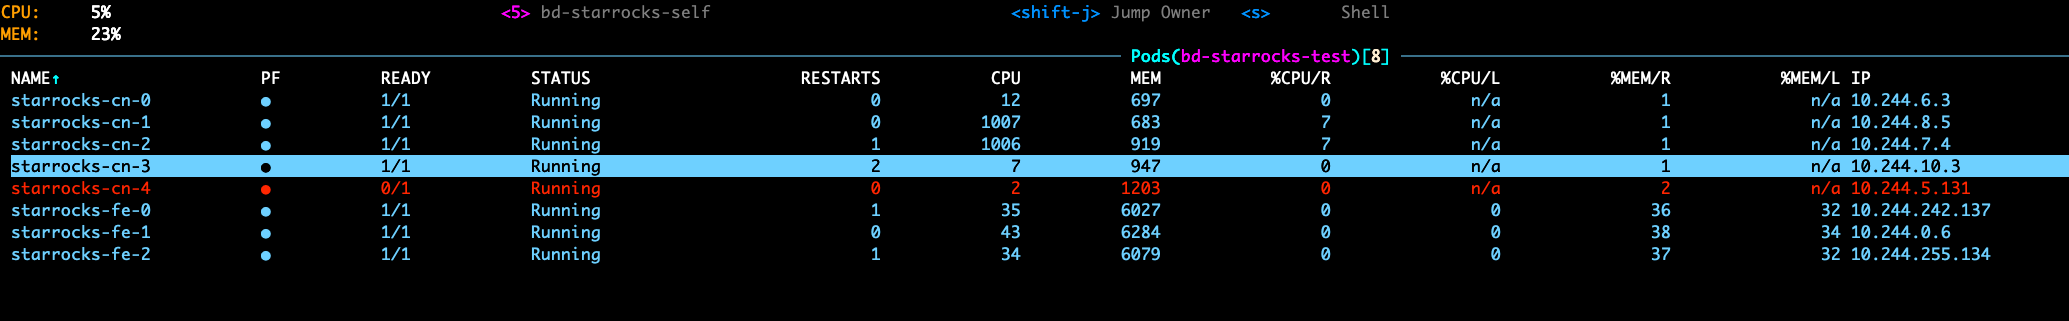
      场景二:  部署一套新的3.5.13的存算分离集群,  也会有同样的问题

     *测试过 3.3.22 /  3.4.10版本, 没有此问题*

【是否存算分离】是
【StarRocks版本】3.5.13 / 3.5.14 (2个版本都尝试了, 一样的问题)
【集群规模】3fe + 10cn
【联系方式】 StarRocks -存算分离1群------ 可以自然点嘛

问题复现:
表结构, 空表


CREATE TABLE dmp.adt_ip_country_source (
  `__dt` datetime NOT NULL COMMENT "数据时间,精确到小时",
  `ip` varchar(50) NOT NULL COMMENT "ip",
  `country` varchar(3) NOT NULL COMMENT "国家",
  `source` varchar(16) NOT NULL COMMENT "IP 来源"
) ENGINE=OLAP
COMMENT "IP 国家表, 用于 IP 活跃度统计"
PARTITION BY date_trunc('hour', __dt)
DISTRIBUTED BY HASH(`ip`, `country`) BUCKETS 1
PROPERTIES (
"compression" = "LZ4",
"datacache.enable" = "true",
"datacache.partition_duration" = "1 days",
"enable_async_write_back" = "false",
"partition_live_number" = "840",
"replication_num" = "1",
"storage_volume" = "volume_hdfs"
);

当执行如下语句时(正常业务场景大都是 insert overwrie 或者 insert into, 概率不低,但也不好复现, 使用这种方式直接复现)

EXPLAIN 
ANALYZE INSERT INTO adt_ip_country_source (__dt,ip,country,source) 
SELECT DATE_ADD('2026-02-02 00:00:00', INTERVAL d hour),'','',''
FROM table(generate_series(0, 23)) AS g(d);

当连续 2 次执行 手动预见分区语句(有时候 1 次就能触发),
超过 5 分钟都不返回,
新开客户端链接到集群, 查看分区已经建立
FE日志中也显示分区建立成功

此时, 再去对任何按天分区表进行插入操作,
插入一个不存在的分区数据
例如, 已有分区’2026-03-01’, 插入一个’202603-02’ 分区的数据

INSERT INTO dmp.adt_ip_country_source SELECT '2026-03-01 02:00:00','1.1.1.1','CHI','xxx';

此时插入无法成功, 提示建立新分区超时(调大超时时间也无效),
此时如果执行创建表的操作, 同样会超时(调大超时时间也无效),
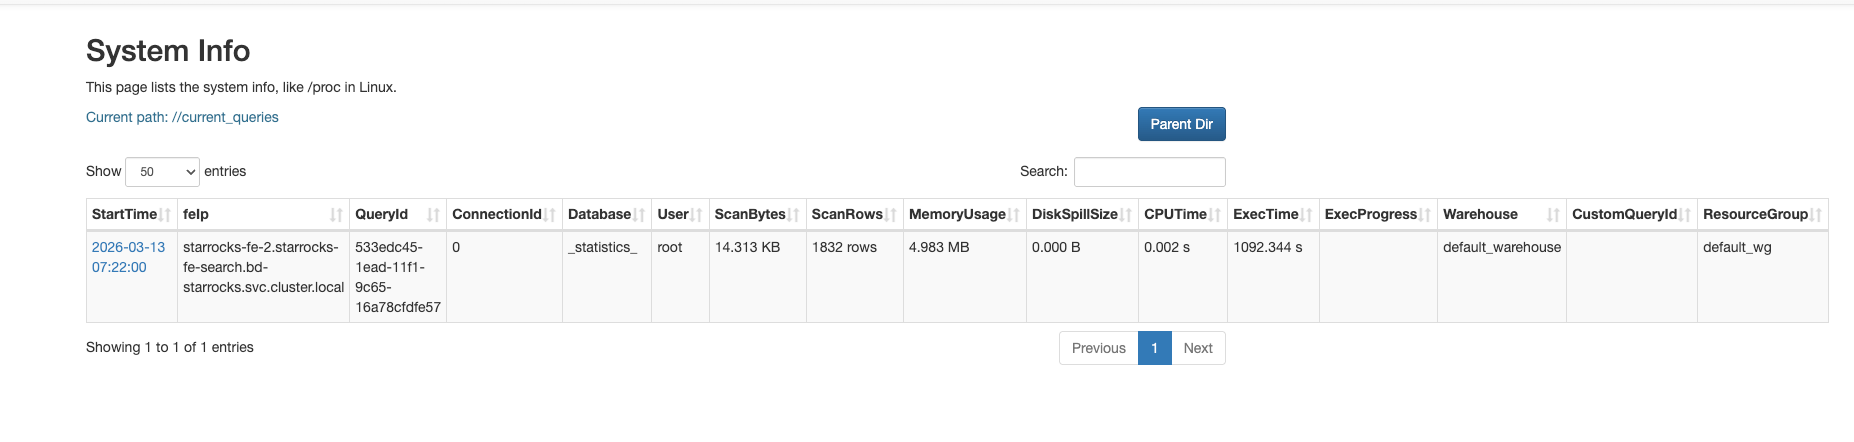
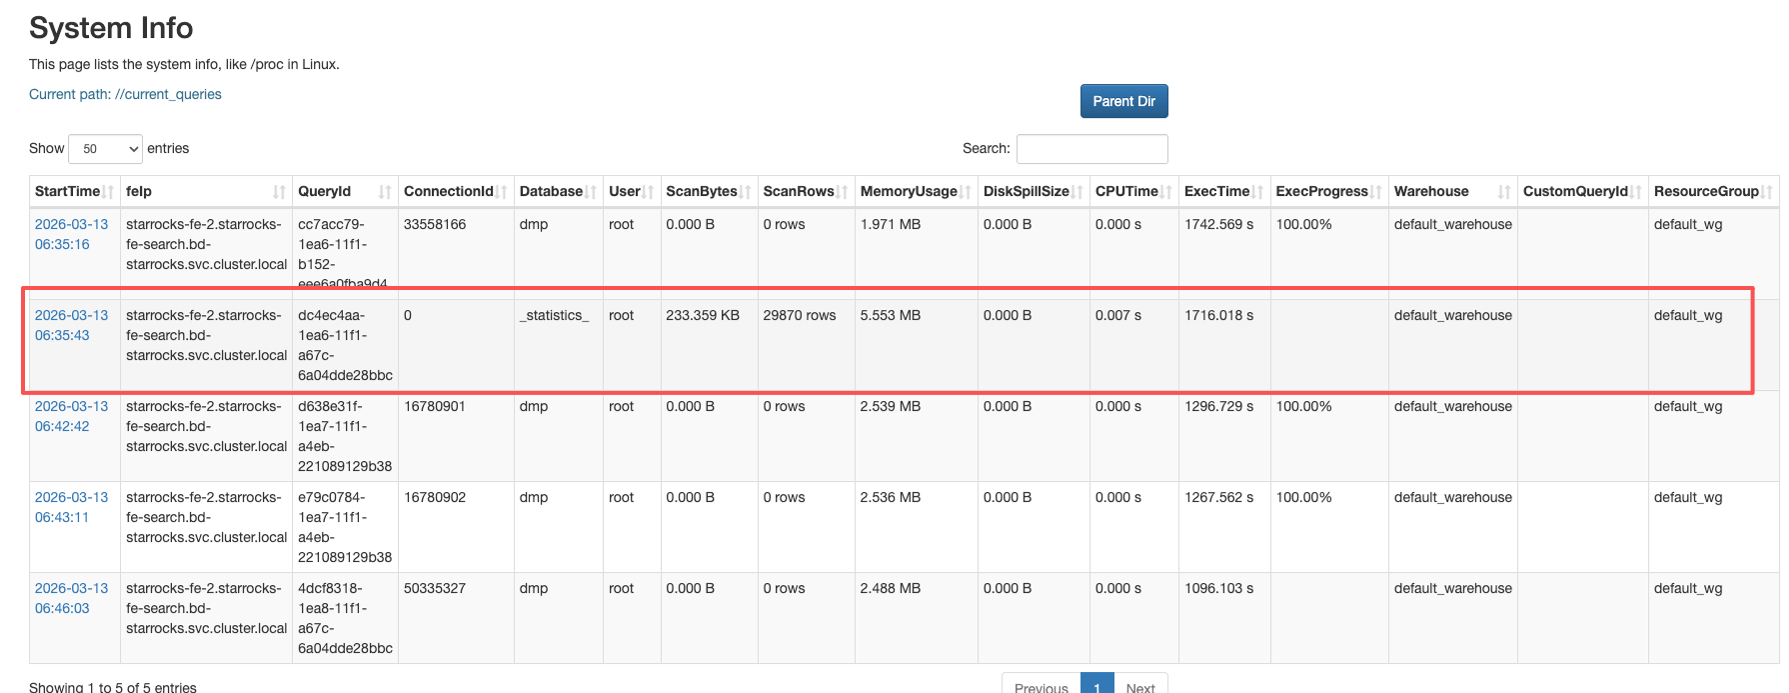
此时ui页面上会出现一个’statistics’库的查询任务 也是一直卡住, 不结束,

这时,
关闭所有 CN 节点, 等待 10 分钟左右,
重启 所有 CN 节点
同时重启 fe 的 leader 节点,
才能恢复正常,

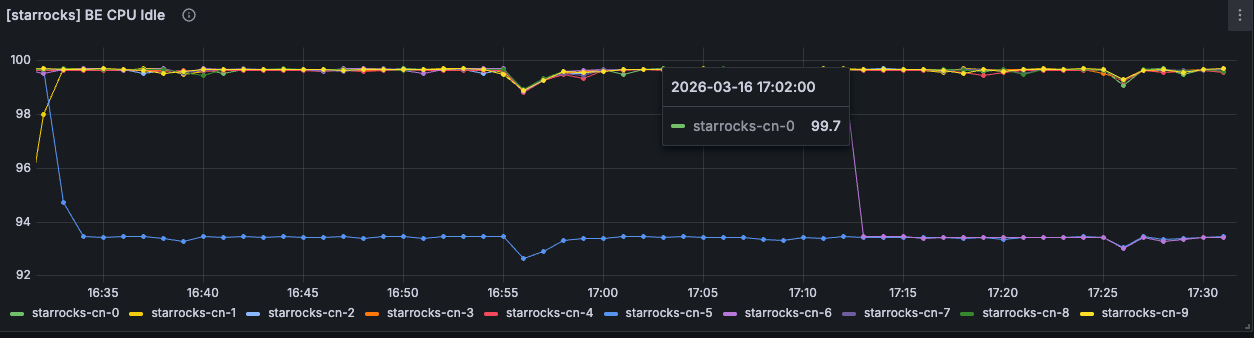
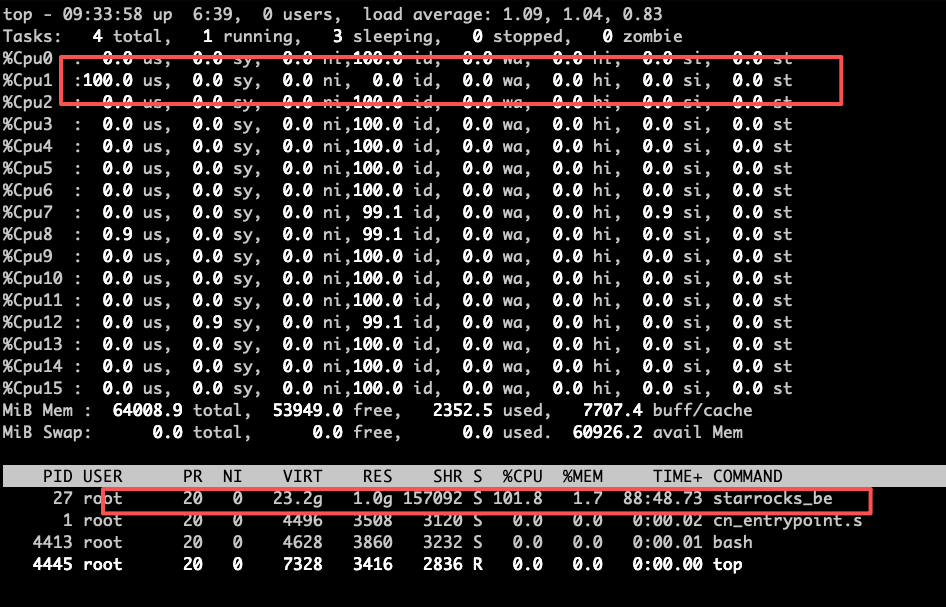
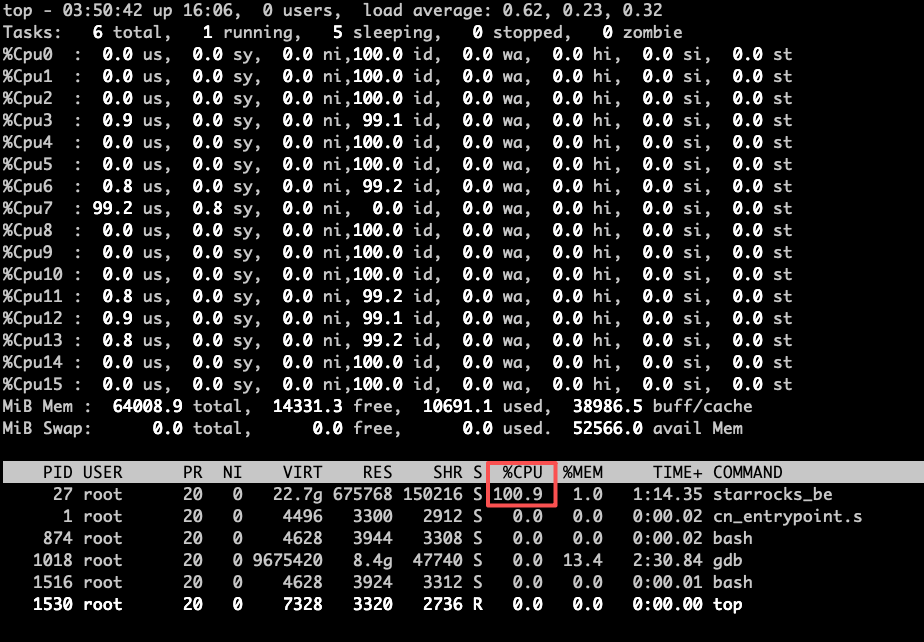
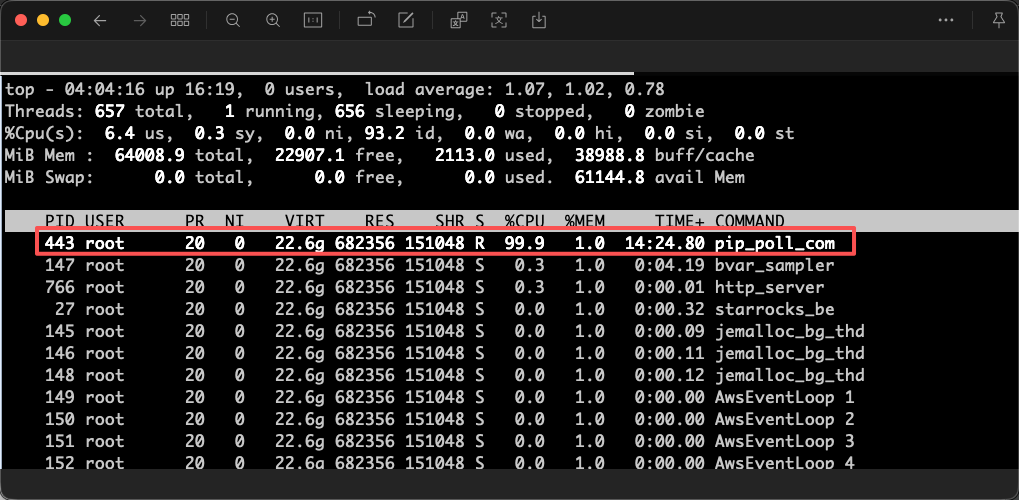
另外关闭 CN 节点时, 发现有一个 CN 节点比其他的关闭的慢, 这个节点就是执行插入数据时报出来超时的那个节点

预见分区时fe日志如下:

10110274394128384; versionTxnType: TXN_NORMAL; storageDataSize: 0; storageRowCount: 0; storageReplicaCount: 1; bucketNum: 1;
2026-03-13 09:03:37.802Z INFO (thrift-server-pool-44|1740) [TabletTaskExecutor.buildPartitionsSequentially():107] build partitions sequentially, send task one by one, all tasks timeout 480s
2026-03-13 09:03:38.826Z INFO (thrift-server-pool-44|1740) [TabletTaskExecutor.buildPartitionsSequentially():110] build partitions sequentially, all tasks finished, took 1028ms
2026-03-13 09:03:38.839Z INFO (thrift-server-pool-44|1740) [LocalMetastore.addRangePartitionLog():1106] succeed in creating partition[10038200], name: p2026020200, temp: false
2026-03-13 09:03:38.839Z INFO (thrift-server-pool-44|1740) [LocalMetastore.addRangePartitionLog():1106] succeed in creating partition[10038203], name: p2026020201, temp: false
2026-03-13 09:03:38.839Z INFO (thrift-server-pool-44|1740) [LocalMetastore.addRangePartitionLog():1106] succeed in creating partition[10038206], name: p2026020202, temp: false
2026-03-13 09:03:38.839Z INFO (thrift-server-pool-44|1740) [LocalMetastore.addRangePartitionLog():1106] succeed in creating partition[10038209], name: p2026020203, temp: false
2026-03-13 09:03:38.839Z INFO (thrift-server-pool-44|1740) [LocalMetastore.addRangePartitionLog():1106] succeed in creating partition[10038212], name: p2026020204, temp: false
2026-03-13 09:03:38.839Z INFO (thrift-server-pool-44|1740) [LocalMetastore.addRangePartitionLog():1106] succeed in creating partition[10038215], name: p2026020205, temp: false
2026-03-13 09:03:38.839Z INFO (thrift-server-pool-44|1740) [LocalMetastore.addRangePartitionLog():1106] succeed in creating partition[10038218], name: p2026020206, temp: false
2026-03-13 09:03:38.839Z INFO (thrift-server-pool-44|1740) [LocalMetastore.addRangePartitionLog():1106] succeed in creating partition[10038221], name: p2026020207, temp: false
2026-03-13 09:03:38.839Z INFO (thrift-server-pool-44|1740) [LocalMetastore.addRangePartitionLog():1106] succeed in creating partition[10038224], name: p2026020208, temp: false
2026-03-13 09:03:38.839Z INFO (thrift-server-pool-44|1740) [LocalMetastore.addRangePartitionLog():1106] succeed in creating partition[10038227], name: p2026020209, temp: false
2026-03-13 09:03:38.839Z INFO (thrift-server-pool-44|1740) [LocalMetastore.addRangePartitionLog():1106] succeed in creating partition[10038230], name: p2026020210, temp: false
2026-03-13 09:03:38.839Z INFO (thrift-server-pool-44|1740) [LocalMetastore.addRangePartitionLog():1106] succeed in creating partition[10038233], name: p2026020211, temp: false
2026-03-13 09:03:38.839Z INFO (thrift-server-pool-44|1740) [LocalMetastore.addRangePartitionLog():1106] succeed in creating partition[10038236], name: p2026020212, temp: false
2026-03-13 09:03:38.839Z INFO (thrift-server-pool-44|1740) [LocalMetastore.addRangePartitionLog():1106] succeed in creating partition[10038239], name: p2026020213, temp: false
2026-03-13 09:03:38.839Z INFO (thrift-server-pool-44|1740) [LocalMetastore.addRangePartitionLog():1106] succeed in creating partition[10038242], name: p2026020214, temp: false
2026-03-13 09:03:38.839Z INFO (thrift-server-pool-44|1740) [LocalMetastore.addRangePartitionLog():1106] succeed in creating partition[10038245], name: p2026020215, temp: false
2026-03-13 09:03:38.839Z INFO (thrift-server-pool-44|1740) [LocalMetastore.addRangePartitionLog():1106] succeed in creating partition[10038248], name: p2026020216, temp: false
2026-03-13 09:03:38.839Z INFO (thrift-server-pool-44|1740) [LocalMetastore.addRangePartitionLog():1106] succeed in creating partition[10038251], name: p2026020217, temp: false
2026-03-13 09:03:38.839Z INFO (thrift-server-pool-44|1740) [LocalMetastore.addRangePartitionLog():1106] succeed in creating partition[10038254], name: p2026020218, temp: false
2026-03-13 09:03:38.839Z INFO (thrift-server-pool-44|1740) [LocalMetastore.addRangePartitionLog():1106] succeed in creating partition[10038257], name: p2026020219, temp: false
2026-03-13 09:03:38.839Z INFO (thrift-server-pool-44|1740) [LocalMetastore.addRangePartitionLog():1106] succeed in creating partition[10038260], name: p2026020220, temp: false
2026-03-13 09:03:38.839Z INFO (thrift-server-pool-44|1740) [LocalMetastore.addRangePartitionLog():1106] succeed in creating partition[10038263], name: p2026020221, temp: false
2026-03-13 09:03:38.840Z INFO (thrift-server-pool-44|1740) [LocalMetastore.addRangePartitionLog():1106] succeed in creating partition[10038266], name: p2026020222, temp: false
2026-03-13 09:03:38.840Z INFO (thrift-server-pool-44|1740) [LocalMetastore.addRangePartitionLog():1106] succeed in creating partition[10038269], name: p2026020223, temp: false
2026-03-13 09:03:46.953Z INFO (star_os_checkpoint_controller|133) [BDBJEJournal.getFinalizedJournalId():272] database names: 117237666
2026-03-13 09:03:46.953Z INFO (star_os_checkpoint_controller|133) [CheckpointController.runCheckpointControllerWithIds():152] checkpoint imageJournalId 117237665, logJournalId 0
2026-03-13 09:03:55.623Z INFO (thrift-server-pool-50|1746) [FrontendServiceImpl.loadTxnBegin():1178] receive txn begin request, db: sr_audit, tbl: audit, label: audit_20260313_090355_starrocks-fe-1_starrocks-fe-search_bd-starrocks_svc_cluster_local_9010, backend: 10.244.4.130
2026-03-13 09:03:55.624Z INFO (thrift-server-pool-50|1746) [StreamLoadMgr.beginLoadTaskFromBackend():175] STREAM_LOAD_TASK=10038272, msg={create load task}
2026-03-13 09:03:55.624Z INFO (thrift-server-pool-50|1746) [DatabaseTransactionMgr.beginTransaction():189] begin transaction: txn_id: 1594118 with label audit_20260313_090355_starrocks-fe-1_starrocks-fe-search_bd-starrocks_svc_cluster_local_9010 from coordinator BE: 10.244.4.130, listner id: 10038272
2026-03-13 09:03:55.624Z INFO (thrift-server-pool-50|1746) [StreamLoadTask.beginTxn():322] stream load audit_20260313_090355_starrocks-fe-1_starrocks-fe-search_bd-starrocks_svc_cluster_local_9010 channel_id 0 begin. db: sr_audit, tbl: audit, txn_id: 1594118
2026-03-13 09:03:55.627Z INFO (thrift-server-pool-48|1744) [DefaultCoordinator.<init>():258] Execution Profile: 054dc608-3acf-54f8-2954-8543a0ddeb98
2026-03-13 09:03:58.652Z INFO (nioEventLoopGroup-5-13|1306) [LoadAction.processNormalStreamLoad():205] redirect load action to destination=TNetworkAddress(hostname:starrocks-cn-0.starrocks-cn-search.bd-starrocks.svc.cluster.local, port:8040), db: sr_audit, tbl: audit, label: audit_20260313_090358_starrocks-fe-2_starrocks-fe-search_bd-starrocks_svc_cluster_local_9010, warehouse: default_warehouse
2026-03-13 09:03:58.654Z INFO (thrift-server-pool-24|1503) [FrontendServiceImpl.loadTxnBegin():1178] receive txn begin request, db: sr_audit, tbl: audit, label: audit_20260313_090358_starrocks-fe-2_starrocks-fe-search_bd-starrocks_svc_cluster_local_9010, backend: 10.244.244.4
2026-03-13 09:03:58.654Z INFO (thrift-server-pool-24|1503) [StreamLoadMgr.beginLoadTaskFromBackend():175] STREAM_LOAD_TASK=10038273, msg={create load task}
2026-03-13 09:03:58.655Z INFO (thrift-server-pool-24|1503) [DatabaseTransactionMgr.beginTransaction():189] begin transaction: txn_id: 1594119 with label audit_20260313_090358_starrocks-fe-2_starrocks-fe-search_bd-starrocks_svc_cluster_local_9010 from coordinator BE: 10.244.244.4, listner id: 10038273
2026-03-13 09:03:58.655Z INFO (thrift-server-pool-24|1503) [StreamLoadTask.beginTxn():322] stream load audit_20260313_090358_starrocks-fe-2_starrocks-fe-search_bd-starrocks_svc_cluster_local_9010 channel_id 0 begin. db: sr_audit, tbl: audit, txn_id: 1594119
2026-03-13 09:03:58.658Z INFO (thrift-server-pool-23|1502) [DefaultCoordinator.<init>():258] Execution Profile: 60474d49-de9c-cdec-2343-04c65f05bb88
2026-03-13 09:04:00.882Z INFO (TaskCleaner|103) [TaskManager.dropTasks():377] drop tasks:[]
2026-03-13 09:04:02.882Z INFO (thrift-server-pool-91|2485) [FrontendServiceImpl.forward():1120] receive forwarded stmt 86 from FE: 10.244.136.144
2026-03-13 09:04:02.883Z INFO (thrift-server-pool-91|2485) [DatabaseTransactionMgr.beginTransaction():189] begin transaction: txn_id: 1594120 with label delete_94c40d09-1ebb-11f1-9d2e-3e2f967789fd from coordinator FE: starrocks-fe-2.starrocks-fe-search.bd-starrocks.svc.cluster.local, listner id: -1
2026-03-13 09:04:02.894Z INFO (thrift-server-pool-91|2485) [DefaultCoordinator.prepareProfile():614] dispatch load job: 94c40d09-1ebb-11f1-9d2e-3e2f967789fd to [10038065, 10038064, 10038147, 10038149, 10038150]
2026-03-13 09:04:02.911Z INFO (PUBLISH_VERSION|25) [PublishVersionDaemon.publishLakeTransactionAsync():473] start publish lake db:10031145 table:10034138 txn:1594120
2026-03-13 09:04:02.914Z INFO (thrift-server-pool-91|2485) [DatabaseTransactionMgr.commitPreparedTransaction():546] transaction:[TransactionState. txn_id: 1594120, label: delete_94c40d09-1ebb-11f1-9d2e-3e2f967789fd, db id: 10031145, table id list: 10034138, callback id: [-1, 10038274], coordinator: FE: starrocks-fe-2.starrocks-fe-search.bd-starrocks.svc.cluster.local, transaction status: COMMITTED, error replicas num: 0, unknown replicas num: 0, prepare time: 1773392642883, write end time: 1773392642909, allow commit time: 1773392642909, commit time: 1773392642909, finish time: -1, write cost: 26ms, wait for publish cost: 2ms, reason: , attachment: com.starrocks.transaction.InsertTxnCommitAttachment@30626099, partition commit info:[]] successfully committed
2026-03-13 09:04:02.918Z INFO (PUBLISH_VERSION|25) [DatabaseTransactionMgr.finishTransaction():1358] finish transaction TransactionState. txn_id: 1594120, label: delete_94c40d09-1ebb-11f1-9d2e-3e2f967789fd, db id: 10031145, table id list: 10034138, callback id: [-1, 10038274], coordinator: FE: starrocks-fe-2.starrocks-fe-search.bd-starrocks.svc.cluster.local, transaction status: VISIBLE, error replicas num: 0, unknown replicas num: 0, prepare time: 1773392642883, write end time: 1773392642909, allow commit time: 1773392642909, commit time: 1773392642909, finish time: 1773392642914, write cost: 26ms, wait for publish cost: 2ms, finish txn cost: 3ms, publish total cost: 5ms, total cost: 31ms, reason: , attachment: com.starrocks.transaction.InsertTxnCommitAttachment@30626099, partition commit info:[] successfully
2026-03-13 09:04:02.925Z INFO (thrift-server-pool-91|2485) [FrontendServiceImpl.forward():1120] receive forwarded stmt 87 from FE: 10.244.136.144
2026-03-13 09:04:02.926Z INFO (thrift-server-pool-91|2485) [DatabaseTransactionMgr.beginTransaction():189] begin transaction: txn_id: 1594121 with label delete_94cb11ec-1ebb-11f1-9d2e-3e2f967789fd from coordinator FE: starrocks-fe-2.starrocks-fe-search.bd-starrocks.svc.cluster.local, listner id: -1
2026-03-13 09:04:02.936Z INFO (thrift-server-pool-91|2485) [DefaultCoordinator.prepareProfile():614] dispatch load job: 94cb11ec-1ebb-11f1-9d2e-3e2f967789fd to [10038065, 10038064, 10038147, 10038149, 10038150]
2026-03-13 09:04:02.954Z INFO (thrift-server-pool-91|2485) [DatabaseTransactionMgr.commitPreparedTransaction():546] transaction:[TransactionState. txn_id: 1594121, label: delete_94cb11ec-1ebb-11f1-9d2e-3e2f967789fd, db id: 10031145, table id list: 10034138, callback id: [-1, 10038275], coordinator: FE: starrocks-fe-2.starrocks-fe-search.bd-starrocks.svc.cluster.local, transaction status: COMMITTED, error replicas num: 0, unknown replicas num: 0, prepare time: 1773392642926, write end time: 1773392642950, allow commit time: 1773392642950, commit time: 1773392642950, finish time: -1, write cost: 24ms, reason: , attachment: com.starrocks.transaction.InsertTxnCommitAttachment@7c5b9579, partition commit info:[]] successfully committed
2026-03-13 09:04:02.958Z INFO (PUBLISH_VERSION|25) [PublishVersionDaemon.publishLakeTransactionAsync():473] start publish lake db:10031145 table:10034138 txn:1594121
2026-03-13 09:04:02.962Z INFO (PUBLISH_VERSION|25) [DatabaseTransactionMgr.finishTransaction():1358] finish transaction TransactionState. txn_id: 1594121, label: delete_94cb11ec-1ebb-11f1-9d2e-3e2f967789fd, db id: 10031145, table id list: 10034138, callback id: [-1, 10038275], coordinator: FE: starrocks-fe-2.starrocks-fe-search.bd-starrocks.svc.cluster.local, transaction status: VISIBLE, error replicas num: 0, unknown replicas num: 0, prepare time: 1773392642926, write end time: 1773392642950, allow commit time: 1773392642950, commit time: 1773392642950, finish time: 1773392642959, write cost: 24ms, wait for publish cost: 8ms, finish txn cost: 1ms, publish total cost: 9ms, total cost: 33ms, reason: , attachment: com.starrocks.transaction.InsertTxnCommitAttachment@7c5b9579, partition commit info:[] successfully
2026-03-13 09:04:03.674Z INFO (PredicateColumnsDaemonThread|152) [DatabaseTransactionMgr.beginTransaction():189] begin transaction: txn_id: 1594122 with label delete_953d34c2-1ebb-11f1-a066-9ac14c6ab7cf from coordinator FE: starrocks-fe-2.starrocks-fe-search.bd-starrocks.svc.cluster.local, listner id: -1
2026-03-13 09:04:03.685Z INFO (PredicateColumnsDaemonThread|152) [DefaultCoordinator.prepareProfile():614] dispatch load job: 953d34c2-1ebb-11f1-a066-9ac14c6ab7cf to [10038065, 10038064, 10038147, 10038149, 10038150]
2026-03-13 09:04:03.698Z INFO (PUBLISH_VERSION|25) [PublishVersionDaemon.publishLakeTransactionAsync():473] start publish lake db:10031145 table:10034138 txn:1594122
2026-03-13 09:04:03.700Z INFO (PredicateColumnsDaemonThread|152) [DatabaseTransactionMgr.commitPreparedTransaction():546] transaction:[TransactionState. txn_id: 1594122, label: delete_953d34c2-1ebb-11f1-a066-9ac14c6ab7cf, db id: 10031145, table id list: 10034138, callback id: [-1, 10038276], coordinator: FE: starrocks-fe-2.starrocks-fe-search.bd-starrocks.svc.cluster.local, transaction status: COMMITTED, error replicas num: 0, unknown replicas num: 0, prepare time: 1773392643674, write end time: 1773392643695, allow commit time: 1773392643695, commit time: 1773392643695, finish time: -1, write cost: 21ms, wait for publish cost: 3ms, reason: , attachment: com.starrocks.transaction.InsertTxnCommitAttachment@7e22e18a, partition commit info:[]] successfully committed
2026-03-13 09:04:03.704Z INFO (PUBLISH_VERSION|25) [DatabaseTransactionMgr.finishTransaction():1358] finish transaction TransactionState. txn_id: 1594122, label: delete_953d34c2-1ebb-11f1-a066-9ac14c6ab7cf, db id: 10031145, table id list: 10034138, callback id: [-1, 10038276], coordinator: FE: starrocks-fe-2.starrocks-fe-search.bd-starrocks.svc.cluster.local, transaction status: VISIBLE, error replicas num: 0, unknown replicas num: 0, prepare time: 1773392643674, write end time: 1773392643695, allow commit time: 1773392643695, commit time: 1773392643695, finish time: 1773392643700, write cost: 21ms, wait for publish cost: 3ms, finish txn cost: 2ms, publish total cost: 5ms, total cost: 26ms, reason: , attachment: com.starrocks.transaction.InsertTxnCommitAttachment@7e22e18a, partition commit info:[] successfully
2026-03-13 09:04:03.708Z INFO (PredicateColumnsDaemonThread|152) [DatabaseTransactionMgr.beginTransaction():189] begin transaction: txn_id: 1594123 with label delete_95428bf5-1ebb-11f1-a066-9ac14c6ab7cf from coordinator FE: starrocks-fe-2.starrocks-fe-search.bd-starrocks.svc.cluster.local, listner id: -1
2026-03-13 09:04:03.719Z INFO (PredicateColumnsDaemonThread|152) [DefaultCoordinator.prepareProfile():614] dispatch load job: 95428bf5-1ebb-11f1-a066-9ac14c6ab7cf to [10038065, 10038064, 10038147, 10038149, 10038150]
2026-03-13 09:04:03.733Z INFO (PredicateColumnsDaemonThread|152) [DatabaseTransactionMgr.commitPreparedTransaction():546] transaction:[TransactionState. txn_id: 1594123, label: delete_95428bf5-1ebb-11f1-a066-9ac14c6ab7cf, db id: 10031145, table id list: 10034138, callback id: [-1, 10038277], coordinator: FE: starrocks-fe-2.starrocks-fe-search.bd-starrocks.svc.cluster.local, transaction status: COMMITTED, error replicas num: 0, unknown replicas num: 0, prepare time: 1773392643709, write end time: 1773392643729, allow commit time: 1773392643729, commit time: 1773392643729, finish time: -1, write cost: 20ms, reason: , attachment: com.starrocks.transaction.InsertTxnCommitAttachment@1c83f656, partition commit info:[]] successfully committed
2026-03-13 09:04:03.734Z INFO (PUBLISH_VERSION|25) [PublishVersionDaemon.publishLakeTransactionAsync():473] start publish lake db:10031145 table:10034138 txn:1594123
2026-03-13 09:04:03.738Z INFO (PUBLISH_VERSION|25) [DatabaseTransactionMgr.finishTransaction():1358] finish transaction TransactionState. txn_id: 1594123, label: delete_95428bf5-1ebb-11f1-a066-9ac14c6ab7cf, db id: 10031145, table id list: 10034138, callback id: [-1, 10038277], coordinator: FE: starrocks-fe-2.starrocks-fe-search.bd-starrocks.svc.cluster.local, transaction status: VISIBLE, error replicas num: 0, unknown replicas num: 0, prepare time: 1773392643709, write end time: 1773392643729, allow commit time: 1773392643729, commit time: 1773392643729, finish time: 1773392643734, write cost: 20ms, wait for publish cost: 5ms, publish total cost: 5ms, total cost: 25ms, reason: , attachment: com.starrocks.transaction.InsertTxnCommitAttachment@1c83f656, partition commit info:[] successfully
2026-03-13 09:04:03.742Z INFO (PredicateColumnsDaemonThread|152) [PredicateColumnsStorage.vacuum():272] vacuum column usage from storage before 2026-03-12T09:04:03.672985121
2026-03-13 09:04:03.742Z INFO (PredicateColumnsDaemonThread|152) [PredicateColumnsStorage.persist():210] persist 0 diffed predicate columns elapsed 20.11 μs, update lastPersist to 2026-03-13T09:04:03.742481716
2026-03-13 09:04:07.615Z INFO (Load history syncer|40) [DatabaseTransactionMgr.beginTransaction():189] begin transaction: txn_id: 1594124 with label insert_9796b52e-1ebb-11f1-a066-9ac14c6ab7cf from coordinator FE: starrocks-fe-2.starrocks-fe-search.bd-starrocks.svc.cluster.local, listner id: -1
2026-03-13 09:04:07.636Z INFO (Load history syncer|40) [DefaultCoordinator.prepareProfile():614] dispatch load job: 9796b52e-1ebb-11f1-a066-9ac14c6ab7cf to [10038065, 10038064, 10038147, 10038149, 10038150]
2026-03-13 09:04:16.182Z INFO (global_state_checkpoint_controller|134) [BDBJEJournal.getFinalizedJournalId():272] database names: 20321977
2026-03-13 09:04:16.182Z INFO (global_state_checkpoint_controller|134) [CheckpointController.runCheckpointControllerWithIds():152] checkpoint imageJournalId 20321976, logJournalId 0
2026-03-13 09:04:19.211Z INFO (MemoryUsageTracker|58) [MemoryUsageTracker.trackMemory():165] (0ms) Module Agent - AgentTaskTracker estimated 0B of memory. Contains AgentTask with 0 object(s).
2026-03-13 09:04:19.211Z INFO (MemoryUsageTracker|58) [MemoryUsageTracker.trackMemory():165] (0ms) Module Backup - BackupHandler estimated 0B of memory. Contains BackupOrRestoreJob with 0 object(s).
2026-03-13 09:04:19.212Z INFO (MemoryUsageTracker|58) [MemoryUsageTracker.trackMemory():165] (0ms) Module Compaction - CompactionMgr estimated 181.6KB of memory. Contains PartitionStats with 3875 object(s).
2026-03-13 09:04:19.212Z INFO (MemoryUsageTracker|58) [MemoryUsageTracker.trackMemory():165] (0ms) Module Coordinator - QeProcessorImpl estimated 160B of memory. Contains QueryCoordinator with 4 object(s).
2026-03-13 09:04:19.212Z INFO (MemoryUsageTracker|58) [MemoryUsageTracker.trackMemory():165] (0ms) Module Delete - DeleteMgr estimated 1.2KB of memory. Contains DeleteInfo with 22 object(s). DeleteJob with 0 object(s).
2026-03-13 09:04:19.212Z INFO (MemoryUsageTracker|58) [MemoryUsageTracker.trackMemory():165] (0ms) Module Dict - CacheDictManager estimated 96B of memory. Contains ColumnDict with 3 object(s).
2026-03-13 09:04:19.212Z INFO (MemoryUsageTracker|58) [MemoryUsageTracker.trackMemory():165] (0ms) Module Export - ExportMgr estimated 0B of memory. Contains ExportJob with 0 object(s).
2026-03-13 09:04:19.213Z INFO (MemoryUsageTracker|58) [MemoryUsageTracker.trackMemory():165] (0ms) Module Load - InsertOverwriteJobMgr estimated 0B of memory. Contains insertOverwriteJobs with 0 object(s).
2026-03-13 09:04:19.213Z INFO (MemoryUsageTracker|58) [MemoryUsageTracker.trackMemory():165] (0ms) Module Load - LoadMgr estimated 20.2KB of memory. Contains LoadJob with 96 object(s).
2026-03-13 09:04:19.213Z INFO (MemoryUsageTracker|58) [MemoryUsageTracker.trackMemory():165] (0ms) Module Load - RoutineLoadMgr estimated 0B of memory. Contains RoutineLoad with 0 object(s).
2026-03-13 09:04:19.213Z INFO (MemoryUsageTracker|58) [MemoryUsageTracker.trackMemory():165] (0ms) Module Load - StreamLoadMgr estimated 3.8KB of memory. Contains StreamLoad with 14 object(s).
2026-03-13 09:04:19.213Z INFO (MemoryUsageTracker|58) [MemoryUsageTracker.trackMemory():165] (0ms) Module LocalMetastore - LocalMetastore estimated 628.9KB of memory. Contains Partition with 4025 object(s).
2026-03-13 09:04:19.213Z INFO (MemoryUsageTracker|58) [MemoryUsageTracker.trackMemory():165] (0ms) Module MV - MVTimelinessMgr estimated 0B of memory. Contains mvTimelinessMap with 0 object(s).
2026-03-13 09:04:19.213Z INFO (MemoryUsageTracker|58) [MemoryUsageTracker.trackMemory():165] (0ms) Module Profile - ProfileManager estimated 744B of memory. Contains QueryProfile with 31 object(s).
2026-03-13 09:04:19.213Z INFO (MemoryUsageTracker|58) [MemoryUsageTracker.trackMemory():165] (0ms) Module Query - QueryTracker estimated 0B of memory. Contains QueryDetail with 0 object(s).
2026-03-13 09:04:19.214Z INFO (MemoryUsageTracker|58) [MemoryUsageTracker.trackMemory():165] (0ms) Module Report - ReportHandler estimated 0B of memory. Contains PendingTask with 0 object(s). ReportQueue with 0 object(s).
2026-03-13 09:04:19.214Z INFO (MemoryUsageTracker|58) [MemoryUsageTracker.trackMemory():165] (0ms) Module Statistics - CachedStatisticStorage estimated 128B of memory. Contains TableStats with 2 object(s). ColumnStats with 4 object(s). PartitionStats with 0 object(s). HistogramStats with 0 object(s). ConnectorTableStats with 0 object(s). ConnectorHistogramStats with 0 object(s). MultiColumnCombinedStats with 1 object(s).
2026-03-13 09:04:19.214Z INFO (MemoryUsageTracker|58) [MemoryUsageTracker.trackMemory():165] (0ms) Module TabletInvertedIndex - TabletInvertedIndex estimated 9MB of memory. Contains TabletMeta with 131883 object(s). TabletCount with 131883 object(s). ReplicateCount with 0 object(s).
2026-03-13 09:04:19.214Z INFO (MemoryUsageTracker|58) [MemoryUsageTracker.trackMemory():165] (0ms) Module Task - TaskManager estimated 23.6KB of memory. Contains Task with 233 object(s).
2026-03-13 09:04:19.214Z INFO (MemoryUsageTracker|58) [MemoryUsageTracker.trackMemory():165] (0ms) Module Task - TaskRunManager estimated 0B of memory. Contains PendingTaskRun with 0 object(s). RunningTaskRun with 0 object(s). HistoryTaskRun with 0 object(s).
2026-03-13 09:04:19.214Z INFO (MemoryUsageTracker|58) [MemoryUsageTracker.trackMemory():165] (0ms) Module Transaction - GlobalTransactionMgr estimated 220.7KB of memory. Contains Txn with 879 object(s). TxnCallbackCount with 4 object(s).
2026-03-13 09:04:19.215Z INFO (MemoryUsageTracker|58) [MemoryUsageTracker.trackMemory():112] total tracked memory: 10.1MB, jvm: Process used: 8GB, heap used: 1.6GB, non heap used: 216.5MB, direct buffer used: 95MB
2026-03-13 09:04:35.287Z INFO (thrift-server-pool-95|2534) [FrontendServiceImpl.forward():1120] receive forwarded stmt 131 from FE: 10.244.136.13
2026-03-13 09:04:35.287Z INFO (thrift-server-pool-95|2534) [DatabaseTransactionMgr.beginTransaction():189] begin transaction: txn_id: 1594125 with label delete_a814d0fb-1ebb-11f1-a729-fa8d85fb3e18 from coordinator FE: starrocks-fe-2.starrocks-fe-search.bd-starrocks.svc.cluster.local, listner id: -1
2026-03-13 09:04:35.298Z INFO (thrift-server-pool-95|2534) [DefaultCoordinator.prepareProfile():614] dispatch load job: a814d0fb-1ebb-11f1-a729-fa8d85fb3e18 to [10038065, 10038064, 10038147, 10038149, 10038150]
2026-03-13 09:04:35.317Z INFO (thrift-server-pool-95|2534) [DatabaseTransactionMgr.commitPreparedTransaction():546] transaction:[TransactionState. txn_id: 1594125, label: delete_a814d0fb-1ebb-11f1-a729-fa8d85fb3e18, db id: 10031145, table id list: 10034138, callback id: [-1, 10038279], coordinator: FE: starrocks-fe-2.starrocks-fe-search.bd-starrocks.svc.cluster.local, transaction status: COMMITTED, error replicas num: 0, unknown replicas num: 0, prepare time: 1773392675288, write end time: 1773392675312, allow commit time: 1773392675312, commit time: 1773392675312, finish time: -1, write cost: 24ms, reason: , attachment: com.starrocks.transaction.InsertTxnCommitAttachment@52880f50, partition commit info:[]] successfully committed
2026-03-13 09:04:35.320Z INFO (PUBLISH_VERSION|25) [PublishVersionDaemon.publishLakeTransactionAsync():473] start publish lake db:10031145 table:10034138 txn:1594125
2026-03-13 09:04:35.324Z INFO (PUBLISH_VERSION|25) [DatabaseTransactionMgr.finishTransaction():1358] finish transaction TransactionState. txn_id: 1594125, label: delete_a814d0fb-1ebb-11f1-a729-fa8d85fb3e18, db id: 10031145, table id list: 10034138, callback id: [-1, 10038279], coordinator: FE: starrocks-fe-2.starrocks-fe-search.bd-starrocks.svc.cluster.local, transaction status: VISIBLE, error replicas num: 0, unknown replicas num: 0, prepare time: 1773392675288, write end time: 1773392675312, allow commit time: 1773392675312, commit time: 1773392675312, finish time: 1773392675320, write cost: 24ms, wait for publish cost: 8ms, publish total cost: 8ms, total cost: 32ms, reason: , attachment: com.starrocks.transaction.InsertTxnCommitAttachment@52880f50, partition commit info:[] successfully
2026-03-13 09:04:35.332Z INFO (thrift-server-pool-95|2534) [FrontendServiceImpl.forward():1120] receive forwarded stmt 132 from FE: 10.244.136.13
2026-03-13 09:04:35.333Z INFO (thrift-server-pool-95|2534) [DatabaseTransactionMgr.beginTransaction():189] begin transaction: txn_id: 1594126 with label delete_a81bfcee-1ebb-11f1-a729-fa8d85fb3e18 from coordinator FE: starrocks-fe-2.starrocks-fe-search.bd-starrocks.svc.cluster.local, listner id: -1
2026-03-13 09:04:35.343Z INFO (thrift-server-pool-95|2534) [DefaultCoordinator.prepareProfile():614] dispatch load job: a81bfcee-1ebb-11f1-a729-fa8d85fb3e18 to [10038065, 10038064, 10038147, 10038149, 10038150]
2026-03-13 09:04:35.360Z INFO (thrift-server-pool-95|2534) [DatabaseTransactionMgr.commitPreparedTransaction():546] transaction:[TransactionState. txn_id: 1594126, label: delete_a81bfcee-1ebb-11f1-a729-fa8d85fb3e18, db id: 10031145, table id list: 10034138, callback id: [-1, 10038280], coordinator: FE: starrocks-fe-2.starrocks-fe-search.bd-starrocks.svc.cluster.local, transaction status: COMMITTED, error replicas num: 0, unknown replicas num: 0, prepare time: 1773392675333, write end time: 1773392675356, allow commit time: 1773392675356, commit time: 1773392675356, finish time: -1, write cost: 23ms, reason: , attachment: com.starrocks.transaction.InsertTxnCommitAttachment@56095f4e, partition commit info:[]] successfully committed
2026-03-13 09:04:35.365Z INFO (PUBLISH_VERSION|25) [PublishVersionDaemon.publishLakeTransactionAsync():473] start publish lake db:10031145 table:10034138 txn:1594126
2026-03-13 09:04:35.369Z INFO (PUBLISH_VERSION|25) [DatabaseTransactionMgr.finishTransaction():1358] finish transaction TransactionState. txn_id: 1594126, label: delete_a81bfcee-1ebb-11f1-a729-fa8d85fb3e18, db id: 10031145, table id list: 10034138, callback id: [-1, 10038280], coordinator: FE: starrocks-fe-2.starrocks-fe-search.bd-starrocks.svc.cluster.local, transaction status: VISIBLE, error replicas num: 0, unknown replicas num: 0, prepare time: 1773392675333, write end time: 1773392675356, allow commit time: 1773392675356, commit time: 1773392675356, finish time: 1773392675365, write cost: 23ms, wait for publish cost: 9ms, publish total cost: 9ms, total cost: 32ms, reason: , attachment: com.starrocks.transaction.InsertTxnCommitAttachment@56095f4e, partition commit info:[] successfully
2026-03-13 09:04:37.120Z INFO (thrift-server-pool-42|1738) [FrontendServiceImpl.loadTxnBegin():1178] receive txn begin request, db: sr_audit, tbl: audit, label: audit_20260313_090437_starrocks-fe-0_starrocks-fe-search_bd-starrocks_svc_cluster_local_9010, backend: 10.244.2.130
2026-03-13 09:04:37.120Z INFO (thrift-server-pool-42|1738) [StreamLoadMgr.beginLoadTaskFromBackend():175] STREAM_LOAD_TASK=10038281, msg={create load task}
2026-03-13 09:04:37.120Z INFO (thrift-server-pool-42|1738) [DatabaseTransactionMgr.beginTransaction():189] begin transaction: txn_id: 1594127 with label audit_20260313_090437_starrocks-fe-0_starrocks-fe-search_bd-starrocks_svc_cluster_local_9010 from coordinator BE: 10.244.2.130, listner id: 10038281
2026-03-13 09:04:37.120Z INFO (thrift-server-pool-42|1738) [StreamLoadTask.beginTxn():322] stream load audit_20260313_090437_starrocks-fe-0_starrocks-fe-search_bd-starrocks_svc_cluster_local_9010 channel_id 0 begin. db: sr_audit, tbl: audit, txn_id: 1594127
2026-03-13 09:04:37.124Z INFO (thrift-server-pool-45|1741) [DefaultCoordinator.<init>():258] Execution Profile: 5b4e9df6-6b95-1848-93f2-46a9a7fcc390
2026-03-13 09:04:46.954Z INFO (star_os_checkpoint_controller|133) [BDBJEJournal.getFinalizedJournalId():272] database names: 117237666
2026-03-13 09:04:46.954Z INFO (star_os_checkpoint_controller|133) [CheckpointController.runCheckpointControllerWithIds():152] checkpoint imageJournalId 117237665, logJournalId 0
2026-03-13 09:04:55.854Z INFO (thrift-server-pool-96|2568) [FrontendServiceImpl.forward():1120] receive forwarded stmt 0 from FE: 10.244.136.144
2026-03-13 09:04:55.876Z WARN (thrift-server-pool-96|2568) [QueryStatisticsInfo.getExecProgress():422] failed to get query progress, query_id: 9796b52e-1ebb-11f1-a066-9ac14c6ab7cf, status code: 404, msg: query id 9796b52e-1ebb-11f1-a066-9ac14c6ab7cf not found.
2026-03-13 09:04:55.886Z WARN (thrift-server-pool-96|2568) [QueryStatisticsInfo.getExecProgress():422] failed to get query progress, query_id: 9796b52e-1ebb-11f1-a066-9ac14c6ab7cf, status code: 404, msg: query id 9796b52e-1ebb-11f1-a066-9ac14c6ab7cf not found.
2026-03-13 09:04:56.742Z INFO (thrift-server-pool-96|2568) [FrontendServiceImpl.forward():1120] receive forwarded stmt 0 from FE: 10.244.136.144
2026-03-13 09:04:56.755Z WARN (thrift-server-pool-96|2568) [QueryStatisticsInfo.getExecProgress():422] failed to get query progress, query_id: 9796b52e-1ebb-11f1-a066-9ac14c6ab7cf, status code: 404, msg: query id 9796b52e-1ebb-11f1-a066-9ac14c6ab7cf not found.
2026-03-13 09:04:56.763Z WARN (thrift-server-pool-96|2568) [QueryStatisticsInfo.getExecProgress():422] failed to get query progress, query_id: 9796b52e-1ebb-11f1-a066-9ac14c6ab7cf, status code: 404, msg: query id 9796b52e-1ebb-11f1-a066-9ac14c6ab7cf not found.
2026-03-13 09:04:57.604Z INFO (thrift-server-pool-96|2568) [FrontendServiceImpl.forward():1120] receive forwarded stmt 0 from FE: 10.244.136.144
2026-03-13 09:04:57.613Z WARN (thrift-server-pool-96|2568) [QueryStatisticsInfo.getExecProgress():422] failed to get query progress, query_id: 9796b52e-1ebb-11f1-a066-9ac14c6ab7cf, status code: 404, msg: query id 9796b52e-1ebb-11f1-a066-9ac14c6ab7cf not found.
2026-03-13 09:04:57.619Z WARN (thrift-server-pool-96|2568) [QueryStatisticsInfo.getExecProgress():422] failed to get query progress, query_id: 9796b52e-1ebb-11f1-a066-9ac14c6ab7cf, status code: 404, msg: query id 9796b52e-1ebb-11f1-a066-9ac14c6ab7cf not found.
2026-03-13 09:04:58.207Z INFO (thrift-server-pool-96|2568) [FrontendServiceImpl.forward():1120] receive forwarded stmt 0 from FE: 10.244.136.144
2026-03-13 09:04:58.217Z WARN (thrift-server-pool-96|2568) [QueryStatisticsInfo.getExecProgress():422] failed to get query progress, query_id: 9796b52e-1ebb-11f1-a066-9ac14c6ab7cf, status code: 404, msg: query id 9796b52e-1ebb-11f1-a066-9ac14c6ab7cf not found.
2026-03-13 09:04:58.225Z WARN (thrift-server-pool-96|2568) [QueryStatisticsInfo.getExecProgress():422] failed to get query progress, query_id: 9796b52e-1ebb-11f1-a066-9ac14c6ab7cf, status code: 404, msg: query id 9796b52e-1ebb-11f1-a066-9ac14c6ab7cf not found.
2026-03-13 09:04:58.688Z INFO (thrift-server-pool-96|2568) [FrontendServiceImpl.forward():1120] receive forwarded stmt 0 from FE: 10.244.136.144
2026-03-13 09:04:58.697Z WARN (thrift-server-pool-96|2568) [QueryStatisticsInfo.getExecProgress():422] failed to get query progress, query_id: 9796b52e-1ebb-11f1-a066-9ac14c6ab7cf, status code: 404, msg: query id 9796b52e-1ebb-11f1-a066-9ac14c6ab7cf not found.
2026-03-13 09:04:58.706Z WARN (thrift-server-pool-96|2568) [QueryStatisticsInfo.getExecProgress():422] failed to get query progress, query_id: 9796b52e-1ebb-11f1-a066-9ac14c6ab7cf, status code: 404, msg: query id 9796b52e-1ebb-11f1-a066-9ac14c6ab7cf not found.
2026-03-13 09:04:59.186Z INFO (thrift-server-pool-96|2568) [FrontendServiceImpl.forward():1120] receive forwarded stmt 0 from FE: 10.244.136.144
2026-03-13 09:04:59.194Z WARN (thrift-server-pool-96|2568) [QueryStatisticsInfo.getExecProgress():422] failed to get query progress, query_id: 9796b52e-1ebb-11f1-a066-9ac14c6ab7cf, status code: 404, msg: query id 9796b52e-1ebb-11f1-a066-9ac14c6ab7cf not found.
2026-03-13 09:04:59.200Z WARN (thrift-server-pool-96|2568) [QueryStatisticsInfo.getExecProgress():422] failed to get query progress, query_id: 9796b52e-1ebb-11f1-a066-9ac14c6ab7cf, status code: 404, msg: query id 9796b52e-1ebb-11f1-a066-9ac14c6ab7cf not found.
2026-03-13 09:04:59.741Z INFO (thrift-server-pool-96|2568) [FrontendServiceImpl.forward():1120] receive forwarded stmt 0 from FE: 10.244.136.144
2026-03-13 09:04:59.750Z WARN (thrift-server-pool-96|2568) [QueryStatisticsInfo.getExecProgress():422] failed to get query progress, query_id: 9796b52e-1ebb-11f1-a066-9ac14c6ab7cf, status code: 404, msg: query id 9796b52e-1ebb-11f1-a066-9ac14c6ab7cf not found.
2026-03-13 09:04:59.758Z WARN (thrift-server-pool-96|2568) [QueryStatisticsInfo.getExecProgress():422] failed to get query progress, query_id: 9796b52e-1ebb-11f1-a066-9ac14c6ab7cf, status code: 404, msg: query id 9796b52e-1ebb-11f1-a066-9ac14c6ab7cf not found.
2026-03-13 09:05:00.365Z INFO (thrift-server-pool-96|2568) [FrontendServiceImpl.forward():1120] receive forwarded stmt 0 from FE: 10.244.136.144
2026-03-13 09:05:00.374Z WARN (thrift-server-pool-96|2568) [QueryStatisticsInfo.getExecProgress():422] failed to get query progress, query_id: 9796b52e-1ebb-11f1-a066-9ac14c6ab7cf, status code: 404, msg: query id 9796b52e-1ebb-11f1-a066-9ac14c6ab7cf not found.
2026-03-13 09:05:00.381Z WARN (thrift-server-pool-96|2568) [QueryStatisticsInfo.getExecProgress():422] failed to get query progress, query_id: 9796b52e-1ebb-11f1-a066-9ac14c6ab7cf, status code: 404, msg: query id 9796b52e-1ebb-11f1-a066-9ac14c6ab7cf not found.
2026-03-13 09:05:00.882Z INFO (TaskCleaner|103) [TaskManager.dropTasks():377] drop tasks:[]
2026-03-13 09:05:00.894Z INFO (com.starrocks.connector.hive.ConnectorTableMetadataProcessor|35) [ConnectorTableMetadataProcessor.refreshCatalogTable():127] Starting to refresh tables from cl_hive:hive metadata cache
2026-03-13 09:05:00.895Z INFO (com.starrocks.connector.hive.ConnectorTableMetadataProcessor|35) [ConnectorTableMetadataProcessor.refreshCatalogTable():157] refresh connector metadata cl_hive finished
2026-03-13 09:05:00.927Z INFO (thrift-server-pool-96|2568) [FrontendServiceImpl.forward():1120] receive forwarded stmt 0 from FE: 10.244.136.144
2026-03-13 09:05:00.929Z INFO (AutoStatistic|28) [StatisticAutoCollector.runJobs():88] auto collect statistic on analyze job[10038282] start
2026-03-13 09:05:00.936Z WARN (thrift-server-pool-96|2568) [QueryStatisticsInfo.getExecProgress():422] failed to get query progress, query_id: 9796b52e-1ebb-11f1-a066-9ac14c6ab7cf, status code: 404, msg: query id 9796b52e-1ebb-11f1-a066-9ac14c6ab7cf not found.
2026-03-13 09:05:00.938Z INFO (DynamicPartitionScheduler|47) [DynamicPartitionScheduler.findSchedulableTables():491] finished to find all schedulable tables, cost: 0ms, dynamic partition tables: {}, ttl partition tables: {dmp=[adt_ip_country_source_ljx, adt_ip_label_num, adt_ip_country_active_last_day_7, adt_ip_bid_floor, adt_ip_country_source_ljx_2, adt_ip_country_source, adt_ip_label_hll, adt_ua_ip_correlation, adt_ip_country_active_last_day_15], _statistics_=[loads_history, task_run_history], monitor=[log], dms=[rtb_device_af_revenue_country, rtb_device_af_revenue, okspin_callback_active, ssp_event_session, rtb_ml_shadding_base, rtb_ml_okspin_left, rtb_ml_billing_right], sr_audit=[audit]}, scheduler enabled: true, scheduler interval: 600s

插入输入的 fe 日志如下


	at com.starrocks.qe.SimpleExecutor.executeDDL(SimpleExecutor.java:146) ~[starrocks-fe.jar:?]
	at com.starrocks.scheduler.history.TableKeeper.createTable(TableKeeper.java:96) ~[starrocks-fe.jar:?]
	at com.starrocks.scheduler.history.TableKeeper.run(TableKeeper.java:68) ~[starrocks-fe.jar:?]
	at com.starrocks.scheduler.history.TableKeeper$TableKeeperDaemon.runAfterCatalogReady(TableKeeper.java:222) ~[starrocks-fe.jar:?]
	at com.starrocks.common.util.FrontendDaemon.runOneCycle(FrontendDaemon.java:72) ~[starrocks-fe.jar:?]
	at com.starrocks.common.util.Daemon.run(Daemon.java:98) ~[starrocks-fe.jar:?]
Caused by: com.starrocks.common.DdlException: Table creation timed out. unfinished replicas(1/1): 10030262(starrocks-cn-5.starrocks-cn-search.bd-starrocks.svc.cluster.local)  timeout=60s
 You can increase the timeout by increasing the config "tablet_create_timeout_second" and try again.
To increase the config "tablet_create_timeout_second" (currently 60), run the following command:

admin set frontend config("tablet_create_timeout_second"="120")

or add the following configuration to the fe.conf file and restart the process:

tablet_create_timeout_second=120

	at com.starrocks.task.TabletTaskExecutor.waitForFinished(TabletTaskExecutor.java:418) ~[starrocks-fe.jar:?]
	at com.starrocks.task.TabletTaskExecutor.sendCreateReplicaTasksAndWaitForFinished(TabletTaskExecutor.java:299) ~[starrocks-fe.jar:?]
	at com.starrocks.task.TabletTaskExecutor.buildPartitionsSequentially(TabletTaskExecutor.java:109) ~[starrocks-fe.jar:?]
	at com.starrocks.server.LocalMetastore.buildPartitions(LocalMetastore.java:1940) ~[starrocks-fe.jar:?]
	at com.starrocks.server.OlapTableFactory.createTable(OlapTableFactory.java:768) ~[starrocks-fe.jar:?]
	at com.starrocks.server.LocalMetastore.createTable(LocalMetastore.java:840) ~[starrocks-fe.jar:?]
	at com.starrocks.server.MetadataMgr.createTable(MetadataMgr.java:300) ~[starrocks-fe.jar:?]
	at com.starrocks.qe.DDLStmtExecutor$StmtExecutorVisitor.lambda$visitCreateTableStatement$4(DDLStmtExecutor.java:298) ~[starrocks-fe.jar:?]
	at com.starrocks.common.ErrorReport.wrapWithRuntimeException(ErrorReport.java:118) ~[starrocks-fe.jar:?]
	at com.starrocks.qe.DDLStmtExecutor$StmtExecutorVisitor.visitCreateTableStatement(DDLStmtExecutor.java:297) ~[starrocks-fe.jar:?]
	at com.starrocks.qe.DDLStmtExecutor$StmtExecutorVisitor.visitCreateTableStatement(DDLStmtExecutor.java:203) ~[starrocks-fe.jar:?]
	at com.starrocks.sql.ast.CreateTableStmt.accept(CreateTableStmt.java:345) ~[starrocks-fe.jar:?]
	at com.starrocks.sql.ast.AstVisitor.visit(AstVisitor.java:101) ~[starrocks-fe.jar:?]
	at com.starrocks.qe.DDLStmtExecutor.execute(DDLStmtExecutor.java:188) ~[starrocks-fe.jar:?]
	at com.starrocks.qe.SimpleExecutor.executeDDL(SimpleExecutor.java:141) ~[starrocks-fe.jar:?]
	... 5 more
2026-03-13 07:52:08.997Z INFO (TableKeeper|100) [LocalMetastore.buildPartitions():1938] start to build 1 partitions sequentially for table _statistics_.loads_history with 3 replicas
2026-03-13 07:52:08.998Z INFO (TableKeeper|100) [TabletTaskExecutor.buildCreateReplicaTasks():223] build create replica tasks for index index id: 10030269; index state: NORMAL; shardGroupId: 286003; row count: 0; tablets size: 3; visibleTxnId: 0; tablets: [tablet: id=10030271, tablet: id=10030272, tablet: id=10030273, ];  db 10030240 table 10030268 partition partitionId: 10030270; partitionName: $shadow_automatic_partition_10030270; parentPartitionId: 10030267; shardGroupId: 286003; isImmutable: false; baseIndex: index id: 10030269; index state: NORMAL; shardGroupId: 286003; row count: 0; tablets size: 3; visibleTxnId: 0; tablets: [tablet: id=10030271, tablet: id=10030272, tablet: id=10030273, ]; ; rollupCount: 0; visibleVersion: 1; visibleVersionTime: 1773388328988; committedVersion: 1; dataVersion: 1; committedDataVersion: 1; versionEpoch: 410101280120242176; versionTxnType: TXN_NORMAL; storageDataSize: 0; storageRowCount: 0; storageReplicaCount: 3; bucketNum: 3;
2026-03-13 07:52:08.998Z INFO (TableKeeper|100) [TabletTaskExecutor.buildPartitionsSequentially():107] build partitions sequentially, send task one by one, all tasks timeout 60s
2026-03-13 07:52:14.166Z INFO (global_state_checkpoint_controller|282) [BDBJEJournal.getFinalizedJournalId():272] database names: 20319174
2026-03-13 07:52:14.166Z INFO (global_state_checkpoint_controller|282) [CheckpointController.runCheckpointControllerWithIds():152] checkpoint imageJournalId 20319173, logJournalId 0

ui截图是测试了多次这是其中 2 次的截图, 都会有个卡主的 statistics 查询,
有些语句进度都显示 100%但是一直不结束


研究一下是哪个BE/CN创建tablet超时

当出现这类问题时, ui 中必然有个一个 statistics 查询, 这个查询的 query_id, 在 fe.warn.log 中提示

 WARN (thrift-server-pool-96516|4267053) [QueryStatisticsInfo.getExecProgress():422] failed to get query progress, query_id: xxx, status code: 404, msg: query id xxx not found.

其中 ‘xxx’ 代表 ui 中 statistics 查询query_id, (之前截图中日志找不到了, 我这重新测试一个)

现在是插入一条数据到新分区(不存在的分区), 客户端返回

INSERT INTO dmp.adt_ip_country_source SELECT '2026-02-04 00:00:00','1.1.1.1','CHI','xxx'
[2026-03-16 11:31:41] [22001][5609] Data truncation: automatic create partition failed. error:Table creation timed out. unfinished replicas(1/1): 10050221(starrocks-cn-6.starrocks-cn-search.bd-starrocks.svc.cluster.local)  timeout=60s
[2026-03-16 11:31:41] You can increase the timeout by increasing the config "tablet_create_timeout_second" and try again.
[2026-03-16 11:31:41] To increase the config "tablet_create_timeout_second" (currently 60), run the following command:
[2026-03-16 11:31:41] ```
[2026-03-16 11:31:41] admin set frontend config("tablet_create_timeout_second"="120")
[2026-03-16 11:31:41] ```
[2026-03-16 11:31:41] or add the following configuration to the fe.conf file and restart the process:
[2026-03-16 11:31:41] ```
[2026-03-16 11:31:41] tablet_create_timeout_second=120
[2026-03-16 11:31:41] ```

进入 starrocks-cn-6.starrocks-cn-search.bd-starrocks.svc.cluster.local pod的内部,
查看 cn/log/cn.WARNING 没有错误信息
查看 cn/log/cn.INFO 报错如下,(pod 中使用的 utc时区, 客户端日志是东八区. 所以差 8 小时)

I20260316 03:30:41.444613 140557802272320 agent_server.cpp:485] Submit task success. type=CREATE, signatures=10050221, task_count_in_queue=1
I20260316 03:30:55.786091 140581716092480 daemon.cpp:140] Current memory statistics: process(11577163984) query_pool(279680344) load(5694448) metadata(32243171) compaction(0) schema_change(0) page_cache(10872221572) update(0) passthrough(0) clone(0) consistency(0) datacache(0) jit(0) replication(0) jemalloc_active(12163182592) jemalloc_allocated(11556439440) jemalloc_metadata(142600816) jemalloc_rss(12294529024)
I20260316 03:31:10.728612 140577543611968 update_manager.cpp:442] index cache expire: before:(0 0) after:(0 0) expire: (0 0)
I20260316 03:31:10.728628 140577543611968 update_manager.cpp:810] update state cache expire: (0 0), index cache expire: (0 0), compaction cache expire: (0 0)
I20260316 03:31:10.752642 140577165940288 heartbeat_server.cpp:78] get heartbeat from FE. host:starrocks-fe-1.starrocks-fe-search.bd-starrocks.svc.cluster.local, port:9020, cluster id:787941996, node type:1, run_mode:SHARED_DATA, counter:397
I20260316 03:31:10.788511 140581716092480 daemon.cpp:140] Current memory statistics: process(11577134816) query_pool(279680344) load(5694448) metadata(32243171) compaction(0) schema_change(0) page_cache(10872221572) update(0) passthrough(0) clone(0) consistency(0) datacache(0) jit(0) replication(0) jemalloc_active(12163215360) jemalloc_allocated(11556369512) jemalloc_metadata(142572144) jemalloc_rss(12294516736)
I20260316 03:31:25.790881 140581716092480 daemon.cpp:140] Current memory statistics: process(11577133792) query_pool(279680344) load(5694448) metadata(32243171) compaction(0) schema_change(0) page_cache(10872221572) update(0) passthrough(0) clone(0) consistency(0) datacache(0) jit(0) replication(0) jemalloc_active(12163239936) jemalloc_allocated(11556405560) jemalloc_metadata(142572144) jemalloc_rss(12292526080)
I20260316 03:31:40.793334 140581716092480 daemon.cpp:140] Current memory statistics: process(11577133792) query_pool(279680344) load(5694448) metadata(32243171) compaction(0) schema_change(0) page_cache(10872221572) update(0) passthrough(0) clone(0) consistency(0) datacache(0) jit(0) replication(0) jemalloc_active(12163420160) jemalloc_allocated(11556616472) jemalloc_metadata(142572144) jemalloc_rss(12294692864)
I20260316 03:31:41.451455 140577020642880 load_channel.cpp:291] Cancel load channel, txn_id=1614062, load_id=8233a443-20e8-11f1-b051-b62ce958567b, reason=Cancelled: Cancelled by pipeline engine, reason: Runtime error: automatic create partition failed. error:Table creation timed out. unfinished replicas(1/1): 10050221(starrocks-cn-6.starrocks-cn-search.bd-starrocks.svc.cluster.local)  timeout=60s
 You can increase the timeout by increasing the config "tablet_create_timeout_second" and try again.
To increase the config "tablet_create_timeout_second" (currently 60), run the following command:

admin set frontend config("tablet_create_timeout_second"="120")

or add the following configuration to the fe.conf file and restart the process:

tablet_create_timeout_second=120

be/src/exec/tablet_sink.cpp:708 this->_automatic_partition_status
I20260316 03:31:41.458752 140577630160448 lake_service.cpp:444] Aborting transactions. request=skip_cleanup: true
txn_infos {
  txn_id: 1614062
  commit_time: 0
  combined_txn_log: false
  txn_type: TXN_NORMAL
  force_publish: false
  gtid: 0
}
I20260316 03:31:55.795739 140581716092480 daemon.cpp:140] Current memory statistics: process(11576824528) query_pool(279680344) load(5694448) metadata(32243171) compaction(0) schema_change(0) page_cache(10872221572) update(0) passthrough(0) clone(0) consi
stency(0) datacache(0) jit(0) replication(0) jemalloc_active(12163465216) jemalloc_allocated(11556427320) jemalloc_metadata(142572144) jemalloc_rss(12291903488)
I20260316 03:32:10.753969 140577165940288 heartbeat_server.cpp:78] get heartbeat from FE. host:starrocks-fe-1.starrocks-fe-search.bd-starrocks.svc.cluster.local, port:9020, cluster id:787941996, node type:1, run_mode:SHARED_DATA, counter:409
I20260316 03:32:10.798208 140581716092480 daemon.cpp:140] Current memory statistics: process(11576824528) query_pool(279680344) load(5694448) metadata(32243171) compaction(0) schema_change(0) page_cache(10872221572) update(0) passthrough(0) clone(0) consi
stency(0) datacache(0) jit(0) replication(0) jemalloc_active(12163481600) jemalloc_allocated(11556413912) jemalloc_metadata(142572144) jemalloc_rss(12294332416)
I20260316 03:32:25.800669 140581716092480 daemon.cpp:140] Current memory statistics: process(11576824400) query_pool(279680344) load(5694448) metadata(32243171) compaction(0) schema_change(0) page_cache(10872221572) update(0) passthrough(0) clone(0) consi
stency(0) datacache(0) jit(0) replication(0) jemalloc_active(12163383296) jemalloc_allocated(11556327568) jemalloc_metadata(142572144) jemalloc_rss(12292632576)
I20260316 03:32:27.709559 140577090405952 starlet.cc:155] Report worker state to 'starrocks-fe-1.starrocks-fe-search.bd-starrocks.svc.cluster.local:6090', counter:205
I20260316 03:32:40.803080 140581716092480 daemon.cpp:140] Current memory statistics: process(11576827120) query_pool(279680344) load(5694448) metadata(32243171) compaction(0) schema_change(0) page_cache(10872221572) update(0) passthrough(0) clone(0) consi
stency(0) datacache(0) jit(0) replication(0) jemalloc_active(12163170304) jemalloc_allocated(11556154600) jemalloc_metadata(142572144) jemalloc_rss(12293750784)

fe中出现了之前没注意到的日志

2026-03-16 05:14:01.680Z ERROR (autovacuum-pool1-t2|374) [AutovacuumDaemon.vacuumPartitionImpl():269] failed to vacuum dmp.adt_ip_country_source.10051126: A error occurred: errorCode=2001 errorMessage:[10.244.245.131:8060]duplicated vacuum request of partition 10051126
2026-03-16 05:14:01.680Z ERROR (autovacuum-pool1-t5|380) [AutovacuumDaemon.vacuumPartitionImpl():269] failed to vacuum dmp.adt_ip_country_source.10051135: A error occurred: errorCode=2001 errorMessage:[10.244.245.131:8060]duplicated vacuum request of partition 10051135

看着是对应的CN出问题, 尝试用admin execute on {cn_id}拿一下pstack看看有没有什么异常栈卡住了.

好像语法不对

admin execute on    10049926;

[2026-03-16 17:27:15] [42000][1064] Getting syntax error at line 1, column 68. Detail message: Unexpected input ';', the most similar input is {SINGLE_QUOTED_TEXT, DOUBLE_QUOTED_TEXT}.


admin execute on    '10049926';

[2026-03-16 17:27:55] [42000][1064] Getting syntax error at line 1, column 60. Detail message: Unexpected input ''10049926'', the most similar input is {'FRONTEND', INTEGER_VALUE}.

# 执行下面的 sql 返回空结果
admin execute on  FRONTEND  '10049926';

另外执行插入语句后, 查看监控如图


蓝色的是 statistics 语句卡主后, 一台 cn 5 节点 CPU 使用比其他的高一些, 16核CPU, 有一核一直是 100%

在没有重启 FE 的情况下,再次执行插入语句(新分区), 紫色的线是 cn6节点开始出现跟 cn5 一样的情况

此时看 ui页面

17点 12 分执行的插入, 紫色线对应的 cn6 节点的 info 日志

datacache(0) jit(0) replication(0) jemalloc_active(689999872) jemalloc_allocated(591843008) jemalloc_metadata(43393072) jemalloc_rss(719454208)
I20260316 09:11:17.495351 140026856908352 starlet.cc:155] Report worker state to 'starrocks-fe-2.starrocks-fe-search.bd-starrocks.svc.cluster.local:6090', counter:1369
I20260316 09:11:29.430142 140031469549120 daemon.cpp:140] Current memory statistics: process(461680128) query_pool(-188219080) load(2338912) metadata(65995) compaction(0) schema_change(0) page_cache(28093) update(0) passthrough(0) clone(0) consistency(0)
datacache(0) jit(0) replication(0) jemalloc_active(690061312) jemalloc_allocated(591877512) jemalloc_metadata(43393072) jemalloc_rss(721580032)
I20260316 09:11:44.432809 140031469549120 daemon.cpp:140] Current memory statistics: process(461680128) query_pool(-188219080) load(2338912) metadata(65995) compaction(0) schema_change(0) page_cache(28093) update(0) passthrough(0) clone(0) consistency(0)
datacache(0) jit(0) replication(0) jemalloc_active(690233344) jemalloc_allocated(592038672) jemalloc_metadata(43393072) jemalloc_rss(720179200)
I20260316 09:11:52.080756 140029449668160 tablet_sink_sender.cpp:353] Olap table sink statistics. load_id: 2ba7b9c6-2118-11f1-97a5-0afbe4ba4d88, txn_id: 1620448, add chunk time(ms)/wait lock time(ms)/num: {10049926:(0)(0)(1)} {10049882:(0)(0)(1)}
I20260316 09:11:52.085995 140029449668160 tablet_sink_sender.cpp:353] Olap table sink statistics. load_id: 2ba7b9c6-2118-11f1-97a5-0afbe4ba4d88, txn_id: 1620448, add chunk time(ms)/wait lock time(ms)/num: {10049926:(0)(0)(1)} {10049882:(0)(0)(1)}
I20260316 09:11:52.091071 140029449668160 tablet_sink_sender.cpp:353] Olap table sink statistics. load_id: 2ba7b9c6-2118-11f1-97a5-0afbe4ba4d88, txn_id: 1620448, add chunk time(ms)/wait lock time(ms)/num: {10049926:(0)(0)(1)} {10049882:(0)(0)(1)}
I20260316 09:11:52.096159 140029449668160 tablet_sink_sender.cpp:353] Olap table sink statistics. load_id: 2ba7b9c6-2118-11f1-97a5-0afbe4ba4d88, txn_id: 1620448, add chunk time(ms)/wait lock time(ms)/num: {10049926:(0)(0)(1)} {10049882:(0)(0)(1)}
I20260316 09:11:58.132295 140027149076032 olap_server.cpp:895] begin to do tablet meta checkpoint:/opt/starrocks/cn/storage/root
I20260316 09:11:59.435237 140031469549120 daemon.cpp:140] Current memory statistics: process(465250896) query_pool(-185587104) load(2346928) metadata(65995) compaction(0) schema_change(0) page_cache(28093) update(0) passthrough(0) clone(0) consistency(0)
datacache(0) jit(0) replication(0) jemalloc_active(692658176) jemalloc_allocated(595156552) jemalloc_metadata(43479088) jemalloc_rss(724107264)
I20260316 09:12:13.394883 140022833735232 heartbeat_server.cpp:78] get heartbeat from FE. host:starrocks-fe-2.starrocks-fe-search.bd-starrocks.svc.cluster.local, port:9020, cluster id:787941996, node type:1, run_mode:SHARED_DATA, counter:2761
I20260316 09:12:14.437647 140031469549120 daemon.cpp:140] Current memory statistics: process(465222560) query_pool(-185587104) load(2346928) metadata(65995) compaction(0) schema_change(0) page_cache(28093) update(0) passthrough(0) clone(0) consistency(0)
datacache(0) jit(0) replication(0) jemalloc_active(692555776) jemalloc_allocated(594838880) jemalloc_metadata(43421744) jemalloc_rss(722432000)
I20260316 09:12:29.440213 140031469549120 daemon.cpp:140] Current memory statistics: process(465290224) query_pool(-185586800) load(2346928) metadata(65995) compaction(0) schema_change(0) page_cache(28093) update(0) passthrough(0) clone(0) consistency(0)
datacache(0) jit(0) replication(0) jemalloc_active(691990528) jemalloc_allocated(594365280) jemalloc_metadata(43421744) jemalloc_rss(723972096)
I20260316 09:12:44.442595 140031469549120 daemon.cpp:140] Current memory statistics: process(465290384) query_pool(-185586800) load(2346928) metadata(65995) compaction(0) schema_change(0) page_cache(28093) update(0) passthrough(0) clone(0) consistency(0)
datacache(0) jit(0) replication(0) jemalloc_active(692043776) jemalloc_allocated(594406800) jemalloc_metadata(43421744) jemalloc_rss(721969152)
I20260316 09:12:58.131647 140027316930112 update_manager.cpp:442] index cache expire: before:(0 0) after:(0 0) expire: (0 0)
I20260316 09:12:58.131665 140027316930112 update_manager.cpp:810] update state cache expire: (0 0), index cache expire: (0 0), compaction cache expire: (0 0)
I20260316 09:12:59.445229 140031469549120 daemon.cpp:140] Current memory statistics: process(465346944) query_pool(-185585984) load(2346928) metadata(65995) compaction(0) schema_change(0) page_cache(28093) update(0) passthrough(0) clone(0) consistency(0)
datacache(0) jit(0) replication(0) jemalloc_active(691884032) jemalloc_allocated(594247200) jemalloc_metadata(43421744) jemalloc_rss(723787776)
I20260316 09:13:13.395015 140022833735232 heartbeat_server.cpp:78] get heartbeat from FE. host:starrocks-fe-2.starrocks-fe-search.bd-starrocks.svc.cluster.local, port:9020, cluster id:787941996, node type:1, run_mode:SHARED_DATA, counter:2773
I20260316 09:13:14.447726 140031469549120 daemon.cpp:140] Current memory statistics: process(465346496) query_pool(-185585984) load(2346928) metadata(65995) compaction(0) schema_change(0) page_cache(28093) update(0) passthrough(0) clone(0) consistency(0)
datacache(0) jit(0) replication(0) jemalloc_active(691920896) jemalloc_allocated(594246736) jemalloc_metadata(43421744) jemalloc_rss(721874944)
I20260316 09:13:15.068685 140027417642560 lake_service.cpp:961] Ignored duplicate vacuum request of partition 10051126
I20260316 09:13:15.068708 140027417642560 lake_service.cpp:961] Ignored duplicate vacuum request of partition 10049887
I20260316 09:13:15.068775 140026675418688 lake_service.cpp:961] Ignored duplicate vacuum request of partition 10035082
I20260316 09:13:17.070131 140026772981312 lake_service.cpp:961] Ignored duplicate vacuum request of partition 10054114
I20260316 09:13:17.070159 140026772981312 lake_service.cpp:961] Ignored duplicate vacuum request of partition 10051135
I20260316 09:13:17.070175 140027426035264 lake_service.cpp:961] Ignored duplicate vacuum request of partition 10054107
I20260316 09:13:17.070212 140027375679040 lake_service.cpp:961] Ignored duplicate vacuum request of partition 10049950
I20260316 09:13:17.931167 140026856908352 starlet.cc:155] Report worker state to 'starrocks-fe-2.starrocks-fe-search.bd-starrocks.svc.cluster.local:6090', counter:1381
I20260316 09:13:29.450454 140031469549120 daemon.cpp:140] Current memory statistics: process(465417328) query_pool(-185585680) load(2346928) metadata(65995) compaction(0) schema_change(0) page_cache(28093) update(0) passthrough(0) clone(0) consistency(0)
datacache(0) jit(0) replication(0) jemalloc_active(691884032) jemalloc_allocated(594297128) jemalloc_metadata(43421744) jemalloc_rss(724140032)
I20260316 09:13:44.452941 140031469549120 daemon.cpp:140] Current memory statistics: process(465417488) query_pool(-185585680) load(2346928) metadata(65995) compaction(0) schema_change(0) page_cache(28093) update(0) passthrough(0) clone(0) consistency(0)
datacache(0) jit(0) replication(0) jemalloc_active(691908608) jemalloc_allocated(594296464) jemalloc_metadata(43421744) jemalloc_rss(721858560)
I20260316 09:13:59.455554 140031469549120 daemon.cpp:140] Current memory statistics: process(465481488) query_pool(-185585376) load(2346928) metadata(65995) compaction(0) schema_change(0) page_cache(28093) update(0) passthrough(0) clone(0) consistency(0)
datacache(0) jit(0) replication(0) jemalloc_active(691699712) jemalloc_allocated(594083288) jemalloc_metadata(43421744) jemalloc_rss(723742720)
I20260316 09:14:13.395607 140022833735232 heartbeat_server.cpp:78] get heartbeat from FE. host:starrocks-fe-2.starrocks-fe-search.bd-starrocks.svc.cluster.local, port:9020, cluster id:787941996, node type:1, run_mode:SHARED_DATA, counter:2785
I20260316 09:14:14.457775 140031469549120 daemon.cpp:140] Current memory statistics: process(465481488) query_pool(-185585376) load(2346928) metadata(65995) compaction(0) schema_change(0) page_cache(28093) update(0) passthrough(0) clone(0) consistency(0)
datacache(0) jit(0) replication(0) jemalloc_active(691720192) jemalloc_allocated(594094048) jemalloc_metadata(43421744) jemalloc_rss(721911808)
I20260316 09:14:29.460397 140031469549120 daemon.cpp:140] Current memory statistics: process(465549696) query_pool(-185585072) load(2346928) metadata(65995) compaction(0) schema_change(0) page_cache(28093) update(0) passthrough(0) clone(0) consistency(0)
datacache(0) jit(0) replication(0) jemalloc_active(691765248) jemalloc_allocated(594101832) jemalloc_metadata(43421744) jemalloc_rss(723161088)
I20260316 09:14:44.462694 140031469549120 daemon.cpp:140] Current memory statistics: process(465549696) query_pool(-185585072) load(2346928) metadata(65995) compaction(0) schema_change(0) page_cache(28093) update(0) passthrough(0) clone(0) consistency(0)
datacache(0) jit(0) replication(0) jemalloc_active(691609600) jemalloc_allocated(593973072) jemalloc_metadata(43421744) jemalloc_rss(721723392)
I20260316 09:14:59.465058 140031469549120 daemon.cpp:140] Current memory statistics: process(465611712) query_pool(-185584768) load(2346928) metadata(65995) compaction(0) schema_change(0) page_cache(28093) update(0) passthrough(0) clone(0) consistency(0)
datacache(0) jit(0) replication(0) jemalloc_active(691671040) jemalloc_allocated(594058144) jemalloc_metadata(43421744) jemalloc_rss(723587072)
I20260316 09:15:13.395633 140022833735232 heartbeat_server.cpp:78] get heartbeat from FE. host:starrocks-fe-2.starrocks-fe-search.bd-starrocks.svc.cluster.local, port:9020, cluster id:787941996, node type:1, run_mode:SHARED_DATA, counter:2797
I20260316 09:15:14.467298 140031469549120 daemon.cpp:140] Current memory statistics: process(465612192) query_pool(-185584768) load(2346928) metadata(65995) compaction(0) schema_change(0) page_cache(28093) update(0) passthrough(0) clone(0) consistency(0)
datacache(0) jit(0) replication(0) jemalloc_active(691720192) jemalloc_allocated(594086112) jemalloc_metadata(43421744) jemalloc_rss(721846272)
I20260316 09:15:18.347867 140026856908352 starlet.cc:155] Report worker state to 'starrocks-fe-2.starrocks-fe-search.bd-starrocks.svc.cluster.local:6090', counter:1393
I20260316 09:15:29.469951 140031469549120 daemon.cpp:140] Current memory statistics: process(465680464) query_pool(-185584464) load(2346928) metadata(65995) compaction(0) schema_change(0) page_cache(28093) update(0) passthrough(0) clone(0) consistency(0)
datacache(0) jit(0) replication(0) jemalloc_active(691535872) jemalloc_allocated(593813856) jemalloc_metadata(43421744) jemalloc_rss(723324928)
I20260316 09:15:44.472317 140031469549120 daemon.cpp:140] Current memory statistics: process(465680624) query_pool(-185584464) load(2346928) metadata(65995) compaction(0) schema_change(0) page_cache(28093) update(0) passthrough(0) clone(0) consistency(0)
datacache(0) jit(0) replication(0) jemalloc_active(691380224) jemalloc_allocated(593694352) jemalloc_metadata(43421744) jemalloc_rss(721272832)
I20260316 09:15:59.474776 140031469549120 daemon.cpp:140] Current memory statistics: process(465728160) query_pool(-185584160) load(2346928) metadata(65995) compaction(0) schema_change(0) page_cache(28093) update(0) passthrough(0) clone(0) consistency(0)
datacache(0) jit(0) replication(0) jemalloc_active(690876416) jemalloc_allocated(593314296) jemalloc_metadata(43421744) jemalloc_rss(722923520)

cn6的 warning日志如下

W20260316 06:29:08.260980 140029337417280 tablet_sink_sender.cpp:299] close channel failed. channel_name=NodeChannel[10049871], load_info=load_id=0e29c5ea-20f9-11f1-a0b7-7655ac8707e6, txn_id: 1619073, parallel=1, compress_type=2, error_msg=Cancelled by pipeline engine, reason: Cancelled: Query reached its timeout of 3600 seconds
W20260316 06:29:08.261026 140029337417280 tablet_sink_sender.cpp:299] close channel failed. channel_name=NodeChannel[10049882], load_info=load_id=0e29c5ea-20f9-11f1-a0b7-7655ac8707e6, txn_id: 1619073, parallel=1, compress_type=2, error_msg=Cancelled by pipeline engine, reason: Cancelled: Query reached its timeout of 3600 seconds
W20260316 06:29:08.260969 140029382526528 tablet_sink_sender.cpp:299] close channel failed. channel_name=NodeChannel[10049871], load_info=load_id=0e29c5ea-20f9-11f1-a0b7-7655ac8707e6, txn_id: 1619073, parallel=1, compress_type=2, error_msg=Cancelled by pipeline engine, reason: Cancelled: Query reached its timeout of 3600 seconds
W20260316 06:29:08.261041 140029382526528 tablet_sink_sender.cpp:299] close channel failed. channel_name=NodeChannel[10049882], load_info=load_id=0e29c5ea-20f9-11f1-a0b7-7655ac8707e6, txn_id: 1619073, parallel=1, compress_type=2, error_msg=Cancelled by pipeline engine, reason: Cancelled: Query reached its timeout of 3600 seconds
W20260316 06:29:08.261019 140029424490048 tablet_sink_sender.cpp:299] close channel failed. channel_name=NodeChannel[10049885], load_info=load_id=0e29c5ea-20f9-11f1-a0b7-7655ac8707e6, txn_id: 1619073, parallel=1, compress_type=2, error_msg=Cancelled by pipeline engine, reason: Cancelled: Query reached its timeout of 3600 seconds
W20260316 06:29:08.261075 140029424490048 tablet_sink_sender.cpp:299] close channel failed. channel_name=NodeChannel[10049872], load_info=load_id=0e29c5ea-20f9-11f1-a0b7-7655ac8707e6, txn_id: 1619073, parallel=1, compress_type=2, error_msg=Cancelled by pipeline engine, reason: Cancelled: Query reached its timeout of 3600 seconds
W20260316 06:29:08.261082 140029424490048 tablet_sink_sender.cpp:299] close channel failed. channel_name=NodeChannel[10049873], load_info=load_id=0e29c5ea-20f9-11f1-a0b7-7655ac8707e6, txn_id: 1619073, parallel=1, compress_type=2, error_msg=Cancelled by pipeline engine, reason: Cancelled: Query reached its timeout of 3600 seconds
W20260316 06:29:08.261089 140029424490048 tablet_sink_sender.cpp:299] close channel failed. channel_name=NodeChannel[10049871], load_info=load_id=0e29c5ea-20f9-11f1-a0b7-7655ac8707e6, txn_id: 1619073, parallel=1, compress_type=2, error_msg=Cancelled by pipeline engine, reason: Cancelled: Query reached its timeout of 3600 seconds
W20260316 06:29:08.261096 140029424490048 tablet_sink_sender.cpp:299] close channel failed. channel_name=NodeChannel[10049882], load_info=load_id=0e29c5ea-20f9-11f1-a0b7-7655ac8707e6, txn_id: 1619073, parallel=1, compress_type=2, error_msg=Cancelled by pipeline engine, reason: Cancelled: Query reached its timeout of 3600 seconds
W20260316 06:29:16.070140 140029776983616 fragment_context.cpp:200] [Driver] Canceled, query_id=12c82d38-20f9-11f1-97a5-0afbe4ba4d88, instance_id=12c82d38-20f9-11f1-97a5-0afbe4ba4d90, reason=Query reached its timeout of 3600 seconds, please increase the 'query_timeout' session variable and retry
W20260316 06:29:16.070488 140029776983616 fragment_context.cpp:200] [Driver] Canceled, query_id=12c82d38-20f9-11f1-97a5-0afbe4ba4d88, instance_id=12c82d38-20f9-11f1-97a5-0afbe4ba4d95, reason=Query reached its timeout of 3600 seconds, please increase the 'query_timeout' session variable and retry
W20260316 06:29:16.072663 140029743412800 fragment_context.cpp:200] [Driver] Canceled, query_id=12c82d38-20f9-11f1-97a5-0afbe4ba4d88, instance_id=12c82d38-20f9-11f1-97a5-0afbe4ba4da7, reason=Query reached its timeout of 3600 seconds, please increase the 'query_timeout' session variable and retry
W20260316 07:28:09.758199 140029329024576 recorder.h:254] Input=2147483647 to `rpc_server_8060_starrocks_pinternal_service_fetch_data' overflows
W20260316 07:30:08.283923 140029751805504 fragment_context.cpp:200] [Driver] Canceled, query_id=93be44c6-2101-11f1-a0b7-7655ac8707e6, instance_id=93be44c6-2101-11f1-a0b7-7655ac8707f0, reason=Query reached its timeout of 3600 seconds
W20260316 08:28:09.769066 140029407704640 recorder.h:254] Input=2147483647 to `rpc_server_8060_starrocks_pinternal_service_fetch_data' overflows
W20260316 08:31:08.317721 140029802161728 fragment_context.cpp:200] [Driver] Canceled, query_id=194b2289-210a-11f1-a0b7-7655ac8707e6, instance_id=194b2289-210a-11f1-a0b7-7655ac8707f0, reason=Query reached its timeout of 3600 seconds
W20260316 09:28:09.779429 140029407704640 recorder.h:254] Input=2147483647 to `rpc_server_8060_starrocks_pinternal_service_fetch_data' overflows
W20260316 09:32:08.349180 140029776983616 fragment_context.cpp:200] [Driver] Canceled, query_id=9ed7da0f-2112-11f1-a0b7-7655ac8707e6, instance_id=9ed7da0f-2112-11f1-a0b7-7655ac8707f0, reason=Query reached its timeout of 3600 seconds

日志里面显示的 3600 秒超时, 是那个 statistics 失败了,此时看 ui, 发现重新生成了一个 statistics 语句

另外我在 fe 的配置文件中增加了禁止 statistics 的配置, 并验证了确实已经生效

    enable_statistic_collect = false
    enable_collect_full_statistic = false
    statistic_auto_analyze_end_time = '00:00:01'

## 通过 sql查看这些配置已经与配置文件中一致
ADMIN SHOW FRONTEND CONFIG LIKE "enable_statistic_collect";
-- enable_statistic_collect	[]	false	boolean	true

ADMIN SHOW FRONTEND CONFIG LIKE "enable_collect_full_statistic";
-- enable_collect_full_statistic	[]	false	boolean	true


ADMIN SHOW FRONTEND CONFIG LIKE "statistic_auto_analyze_start_time";
-- statistic_auto_analyze_start_time	[]	00:00:00	String	true

ADMIN SHOW FRONTEND CONFIG LIKE "statistic_auto_analyze_end_time";
-- statistic_auto_analyze_end_time	[]	'00:00:01'	String	true

但是 ui 页面中仍然能看到新生成的运行中的 statistics 的查询

清理了 fe/cn 的 log/xx.out 日志, 插入报错时, xx.out没有新的打印

使用 grep ${query_id} 查看 fe leader 日志如下

root@starrocks-fe-1:/opt/starrocks# grep 41d834d7-21c8-11f1-aa1a-2acaf5152eca fe/log/fe.log


2026-03-17 06:12:20.709Z INFO (thrift-server-pool-5258|39423) [DatabaseTransactionMgr.beginTransaction():189] begin transaction: txn_id: 1631199 with label insert_41d834d7-21c8-11f1-aa1a-2acaf5152eca from coordinator FE: starrocks-fe-1.starrocks-fe-search.bd-starrocks.svc.cluster.local, listner id: -1
2026-03-17 06:12:20.715Z INFO (thrift-server-pool-5258|39423) [DefaultCoordinator.prepareProfile():614] dispatch load job: 41d834d7-21c8-11f1-aa1a-2acaf5152eca to [10059484]
2026-03-17 06:12:32.818Z WARN (thrift-server-pool-5262|39466) [QueryStatisticsInfo.getExecProgress():422] failed to get query progress, query_id: 41d834d7-21c8-11f1-aa1a-2acaf5152eca, status code: 404, msg: query id 41d834d7-21c8-11f1-aa1a-2acaf5152eca not found.
2026-03-17 06:12:32.822Z WARN (thrift-server-pool-5262|39466) [QueryStatisticsInfo.getExecProgress():422] failed to get query progress, query_id: 41d834d7-21c8-11f1-aa1a-2acaf5152eca, status code: 404, msg: query id 41d834d7-21c8-11f1-aa1a-2acaf5152eca not found.
2026-03-17 06:12:33.807Z WARN (thrift-server-pool-5262|39466) [QueryStatisticsInfo.getExecProgress():422] failed to get query progress, query_id: 41d834d7-21c8-11f1-aa1a-2acaf5152eca, status code: 404, msg: query id 41d834d7-21c8-11f1-aa1a-2acaf5152eca not found.
2026-03-17 06:12:33.810Z WARN (thrift-server-pool-5262|39466) [QueryStatisticsInfo.getExecProgress():422] failed to get query progress, query_id: 41d834d7-21c8-11f1-aa1a-2acaf5152eca, status code: 404, msg: query id 41d834d7-21c8-11f1-aa1a-2acaf5152eca not found.
2026-03-17 06:12:34.461Z WARN (thrift-server-pool-5262|39466) [QueryStatisticsInfo.getExecProgress():422] failed to get query progress, query_id: 41d834d7-21c8-11f1-aa1a-2acaf5152eca, status code: 404, msg: query id 41d834d7-21c8-11f1-aa1a-2acaf5152eca not found.
2026-03-17 06:12:34.464Z WARN (thrift-server-pool-5262|39466) [QueryStatisticsInfo.getExecProgress():422] failed to get query progress, query_id: 41d834d7-21c8-11f1-aa1a-2acaf5152eca, status code: 404, msg: query id 41d834d7-21c8-11f1-aa1a-2acaf5152eca not found.
```, query_id=41d834d7-21c8-11f1-aa1a-2acaf5152eca, instance_id=41d834d7-21c8-11f1-aa1a-2acaf5152ecb, backend_id=10059484
2026-03-17 06:13:20.740Z WARN (thrift-server-pool-5264|39516) [DefaultCoordinator.updateStatus():885] one instance report fail throw updateStatus(), need cancel. job id: 10061340, query id: 41d834d7-21c8-11f1-aa1a-2acaf5152eca, instance id: 41d834d7-21c8-11f1-aa1a-2acaf5152ecb
2026-03-17 06:13:20.741Z WARN (thrift-server-pool-5258|39423) [StmtExecutor.handleDMLStmt():2949] failed to handle stmt [/* ApplicationName=DataGrip 2024.3.1 */ INSERT INTO dmp.adt_ip_country_source_ljx_2 SELECT '2026-02-23 01:00:00','1.1.1.1','CHI','xxx'] label: insert_41d834d7-21c8-11f1-aa1a-2acaf5152eca
2026-03-17 06:13:20.745Z INFO (thrift-server-pool-5258|39423) [DatabaseTransactionMgr.abortTransaction():636] transaction:[TransactionState. txn_id: 1631199, label: insert_41d834d7-21c8-11f1-aa1a-2acaf5152eca, db id: 5058574, table id list: 10038178, callback id: [-1, 10061340], coordinator: FE: starrocks-fe-1.starrocks-fe-search.bd-starrocks.svc.cluster.local, transaction status: ABORTED, error replicas num: 0, unknown replicas num: 0, prepare time: 1773727940709, write end time: -1, allow commit time: -1, commit time: -1, finish time: 1773728000741, total cost: 60032ms, reason: automatic create partition failed. error:Table creation timed out. unfinished replicas(1/1): 10061343(starrocks-cn-7.starrocks-cn-search.bd-starrocks.svc.cluster.local)  timeout=60s

此时fe.out日志

root@starrocks-fe-1:/opt/starrocks# cat fe/log/fe.out

Mar 17, 2026 6:08:10 AM com.baidu.jprotobuf.pbrpc.transport.RpcTimerTask run
WARNING: correlationId:40258 timeout with bound channel =>[id: 0xff5f6253, L:/10.244.6.6:52138 - R:/10.244.55.3:8060]
Mar 17, 2026 6:09:08 AM com.baidu.jprotobuf.pbrpc.transport.RpcTimerTask run
WARNING: correlationId:39997 timeout with bound channel =>[id: 0x5ab41981, L:/10.244.6.6:52150 - R:/10.244.55.3:8060]
Mar 17, 2026 6:18:10 AM com.baidu.jprotobuf.pbrpc.transport.RpcTimerTask run
WARNING: correlationId:40891 timeout with bound channel =>[id: 0xff5f6253, L:/10.244.6.6:52138 - R:/10.244.55.3:8060]

其中 10.244.6.6 是 fe, 10.244.55.3 cn节点对应日志中的 starrocks-cn-7
IP对应关系如下图

fe.info日志中有一句

query_id=41d834d7-21c8-11f1-aa1a-2acaf5152eca, instance_id=41d834d7-21c8-11f1-aa1a-2acaf5152ecb, backend_id=10059484

此backend_id=10059484 对应的cn节点为 starrocks-cn-4
查看starrocks-cn-4cn.out日志为空(查询前清理了), cn.info 日志如下

root@starrocks-cn-4:/opt/starrocks# grep 41d834d7-21c8-11f1-aa1a-2acaf5152eca cn/log/cn.INFO


I20260317 06:12:20.720390 139961686730304 tablet_sink.cpp:437] load_id=41d834d7-21c8-11f1-aa1a-2acaf5152eca, txn_id: 1631199 automatic partition rpc begin request TCreatePartitionRequest(txn_id=1631199, db_id=5058574, table_id=10038178, partition_values=[[2026-02-23 01:00:00]], is_temp=<null>)
I20260317 06:12:20.726107 139964896233024 tablet_sink_sender.cpp:353] Olap table sink statistics. load_id: 41d834d7-21c8-11f1-aa1a-2acaf5152eca, txn_id: 1631199, add chunk time(ms)/wait lock time(ms)/num: {10059486:(0)(0)(1)} {10059473:(0)(0)(1)} {10059485:(0)(0)(1)} {10059472:(0)(0)(1)} {10059482:(0)(0)(1)} {10059471:(0)(0)(1)}
I20260317 06:12:20.731186 139964896233024 tablet_sink_sender.cpp:353] Olap table sink statistics. load_id: 41d834d7-21c8-11f1-aa1a-2acaf5152eca, txn_id: 1631199, add chunk time(ms)/wait lock time(ms)/num: {10059486:(0)(0)(1)} {10059473:(0)(0)(1)} {10059485:(0)(0)(1)} {10059472:(0)(0)(1)} {10059482:(0)(0)(1)} {10059471:(0)(0)(1)}
I20260317 06:12:20.736272 139964896233024 tablet_sink_sender.cpp:353] Olap table sink statistics. load_id: 41d834d7-21c8-11f1-aa1a-2acaf5152eca, txn_id: 1631199, add chunk time(ms)/wait lock time(ms)/num: {10059486:(0)(0)(1)} {10059473:(0)(0)(1)} {10059485:(0)(0)(1)} {10059472:(0)(0)(1)} {10059482:(0)(0)(1)} {10059471:(0)(0)(1)}
I20260317 06:12:20.741344 139964896233024 tablet_sink_sender.cpp:353] Olap table sink statistics. load_id: 41d834d7-21c8-11f1-aa1a-2acaf5152eca, txn_id: 1631199, add chunk time(ms)/wait lock time(ms)/num: {10059486:(0)(0)(1)} {10059473:(0)(0)(1)} {10059485:(0)(0)(1)} {10059472:(0)(0)(1)} {10059482:(0)(0)(1)} {10059471:(0)(0)(1)}
I20260317 06:13:20.737932 139961686730304 tablet_sink.cpp:457] load_id=41d834d7-21c8-11f1-aa1a-2acaf5152eca, txn_id: 1631199 automatic partition rpc end response TCreatePartitionResult(status=TStatus(status_code=RUNTIME_ERROR, error_msgs=[automatic create partition failed. error:Table creation timed out. unfinished replicas(1/1): 10061343(starrocks-cn-7.starrocks-cn-search.bd-starrocks.svc.cluster.local)  timeout=60s
I20260317 06:13:20.738366 139964783982144 tablet_sink_sender.cpp:353] Olap table sink statistics. load_id: 41d834d7-21c8-11f1-aa1a-2acaf5152eca, txn_id: 1631199, add chunk time(ms)/wait lock time(ms)/num: {10059486:(0)(0)(0)} {10059473:(0)(0)(0)} {10059485:(0)(0)(0)} {10059472:(0)(0)(0)} {10059482:(0)(0)(0)} {10059471:(0)(0)(0)}
W20260317 06:13:20.738381 139964783982144 pipeline_driver.cpp:601] cancel pipeline driver error [driver=query_id=41d834d7-21c8-11f1-aa1a-2acaf5152eca fragment_id=41d834d7-21c8-11f1-aa1a-2acaf5152ecb driver=driver_-1_1 addr=0x7f4b5cf47910, status=CANCELED, operator-chain: [local_exchange_source_-1_0x7f4b631ce010(X) { has_output:false} -> olap_table_sink_-1_0x7f4b5ced7a10(X)]]: Cancelled: Cancelled by pipeline engine, reason: Runtime error: automatic create partition failed. error:Table creation timed out. unfinished replicas(1/1): 10061343(starrocks-cn-7.starrocks-cn-search.bd-starrocks.svc.cluster.local)  timeout=60s
W20260317 06:13:20.738402 139964783982144 tablet_sink_sender.cpp:250] close channel failed. channel_name=NodeChannel[10059471], load_info=load_id=41d834d7-21c8-11f1-aa1a-2acaf5152eca, txn_id: 1631199, parallel=1, compress_type=2, error_msg=Cancelled by pipeline engine, reason: Runtime error: automatic create partition failed. error:Table creation timed out. unfinished replicas(1/1): 10061343(starrocks-cn-7.starrocks-cn-search.bd-starrocks.svc.cluster.local)  timeout=60s
W20260317 06:13:20.738424 139964783982144 tablet_sink_sender.cpp:250] close channel failed. channel_name=NodeChannel[10059482], load_info=load_id=41d834d7-21c8-11f1-aa1a-2acaf5152eca, txn_id: 1631199, parallel=1, compress_type=2, error_msg=Cancelled by pipeline engine, reason: Runtime error: automatic create partition failed. error:Table creation timed out. unfinished replicas(1/1): 10061343(starrocks-cn-7.starrocks-cn-search.bd-starrocks.svc.cluster.local)  timeout=60s
W20260317 06:13:20.738429 139964783982144 tablet_sink_sender.cpp:250] close channel failed. channel_name=NodeChannel[10059472], load_info=load_id=41d834d7-21c8-11f1-aa1a-2acaf5152eca, txn_id: 1631199, parallel=1, compress_type=2, error_msg=Cancelled by pipeline engine, reason: Runtime error: automatic create partition failed. error:Table creation timed out. unfinished replicas(1/1): 10061343(starrocks-cn-7.starrocks-cn-search.bd-starrocks.svc.cluster.local)  timeout=60s
W20260317 06:13:20.738438 139964783982144 tablet_sink_sender.cpp:250] close channel failed. channel_name=NodeChannel[10059485], load_info=load_id=41d834d7-21c8-11f1-aa1a-2acaf5152eca, txn_id: 1631199, parallel=1, compress_type=2, error_msg=Cancelled by pipeline engine, reason: Runtime error: automatic create partition failed. error:Table creation timed out. unfinished replicas(1/1): 10061343(starrocks-cn-7.starrocks-cn-search.bd-starrocks.svc.cluster.local)  timeout=60s
W20260317 06:13:20.738442 139964783982144 tablet_sink_sender.cpp:250] close channel failed. channel_name=NodeChannel[10059473], load_info=load_id=41d834d7-21c8-11f1-aa1a-2acaf5152eca, txn_id: 1631199, parallel=1, compress_type=2, error_msg=Cancelled by pipeline engine, reason: Runtime error: automatic create partition failed. error:Table creation timed out. unfinished replicas(1/1): 10061343(starrocks-cn-7.starrocks-cn-search.bd-starrocks.svc.cluster.local)  timeout=60s
W20260317 06:13:20.738447 139964783982144 tablet_sink_sender.cpp:250] close channel failed. channel_name=NodeChannel[10059486], load_info=load_id=41d834d7-21c8-11f1-aa1a-2acaf5152eca, txn_id: 1631199, parallel=1, compress_type=2, error_msg=Cancelled by pipeline engine, reason: Runtime error: automatic create partition failed. error:Table creation timed out. unfinished replicas(1/1): 10061343(starrocks-cn-7.starrocks-cn-search.bd-starrocks.svc.cluster.local)  timeout=60s
I20260317 06:13:20.738461 139964783982144 tablet_sink_sender.cpp:353] Olap table sink statistics. load_id: 41d834d7-21c8-11f1-aa1a-2acaf5152eca, txn_id: 1631199, add chunk time(ms)/wait lock time(ms)/num: {10059486:(0)(0)(0)} {10059473:(0)(0)(0)} {10059485:(0)(0)(0)} {10059472:(0)(0)(0)} {10059482:(0)(0)(0)} {10059471:(0)(0)(0)}
I20260317 06:13:20.739521 139964783982144 query_context.cpp:60] finished query_id:41d834d7-21c8-11f1-aa1a-2acaf5152eca context life time:60023102449 cpu costs:250888 peak memusage:2655992 scan_bytes:0 spilled bytes:0

starrocks-cn-4cn.info日志中跟 fe.log中 一样, 体现出是 starrocks-cn-7 有问题

查看 starrocks-cn-7cn.out日志为空(查询前清理了), cn.info 日志如下

I20260317 06:13:14.474396 140489349125696 daemon.cpp:140] Current memory statistics: process(308403904) query_pool(0) load(0) metadata(2399703) compaction(0) schema_change(0) page_cache(76418) update(0) passthrough(0) clone(0) consistency(0) datacache(0)
jit(0) replication(0) jemalloc_active(477192192) jemalloc_allocated(445380136) jemalloc_metadata(32900768) jemalloc_rss(499179520)
I20260317 06:13:20.738479 140484640048704 load_channel.cpp:291] Cancel load channel, txn_id=1631199, load_id=41d834d7-21c8-11f1-aa1a-2acaf5152eca, reason=Cancelled: Cancelled by pipeline engine, reason: Runtime error: automatic create partition failed. error:Table creation timed out. unfinished replicas(1/1): 10061343(starrocks-cn-7.starrocks-cn-search.bd-starrocks.svc.cluster.local)  timeout=60s
 You can increase the timeout by increasing the config "tablet_create_timeout_second" and try again.
To increase the config "tablet_create_timeout_second" (currently 60), run the following command:

admin set frontend config("tablet_create_timeout_second"="120")

or add the following configuration to the fe.conf file and restart the process:

tablet_create_timeout_second=120

be/src/exec/tablet_sink.cpp:708 this->_automatic_partition_status
I20260317 06:13:20.746199 140485255337536 lake_service.cpp:444] Aborting transactions. request=skip_cleanup: true
txn_infos {
  txn_id: 1631199
  commit_time: 0
  combined_txn_log: false
  txn_type: TXN_NORMAL
  force_publish: false
  gtid: 0
}
I20260317 06:13:28.893696 140487309784640 tablet_sink_sender.cpp:353] Olap table sink statistics. load_id: 6a7a4638-21c8-11f1-bc9b-0a9410f95593, txn_id: 1631207, add chunk time(ms)/wait lock time(ms)/num: {10059472:(0)(0)(1)} {10059485:(0)(0)(1)} {1005948
2:(0)(0)(1)} {10059473:(0)(0)(1)} {10059486:(0)(0)(1)} {10059474:(0)(0)(1)} {10059471:(0)(0)(1)} {10059481:(0)(0)(1)}
I20260317 06:13:28.923689 140487309784640 tablet_sink_sender.cpp:353] Olap table sink statistics. load_id: 6a7f4f4b-21c8-11f1-bc9b-0a9410f95593, txn_id: 1631208, add chunk time(ms)/wait lock time(ms)/num: {10059472:(0)(0)(1)} {10059485:(0)(0)(1)} {1005948
2:(0)(0)(1)} {10059473:(0)(0)(1)} {10059486:(0)(0)(1)} {10059474:(0)(0)(1)} {10059471:(0)(0)(1)} {10059481:(0)(0)(1)}
I20260317 06:13:29.477055 140489349125696 daemon.cpp:140] Current memory statistics: process(307998488) query_pool(0) load(0) metadata(2399703) compaction(0) schema_change(0) page_cache(76418) update(0) passthrough(0) clone(0) consistency(0) datacache(0)
jit(0) replication(0) jemalloc_active(476971008) jemalloc_allocated(444590384) jemalloc_metadata(32843424) jemalloc_rss(497602560)
I20260317 06:13:33.654638 140487309784640 tablet_sink_sender.cpp:353] Olap table sink statistics. load_id: 6d50be64-21c8-11f1-aa1a-2acaf5152eca, txn_id: 1631209, add chunk time(ms)/wait lock time(ms)/num: {10059472:(0)(0)(1)} {10059485:(0)(0)(1)} {1005948
2:(0)(0)(1)} {10059473:(0)(0)(1)} {10059486:(0)(0)(1)} {10059474:(0)(0)(1)} {10059471:(0)(0)(1)} {10059481:(0)(0)(1)}
I20260317 06:13:33.682968 140487309784640 tablet_sink_sender.cpp:353] Olap table sink statistics. load_id: 6d557957-21c8-11f1-aa1a-2acaf5152eca, txn_id: 1631210, add chunk time(ms)/wait lock time(ms)/num: {10059472:(0)(0)(1)} {10059485:(0)(0)(1)} {1005948
2:(0)(0)(1)} {10059473:(0)(0)(1)} {10059486:(0)(0)(1)} {10059474:(0)(0)(1)} {10059471:(0)(0)(1)} {10059481:(0)(0)(1)}
admin execute on {backend_id} 'System.print(ExecEnv.get_stack_trace_for_all_uthreads())'

需要替换成真实的BE/CN id

执行 Iadmin execute on 10059486 'System.print(ExecEnv.get_stack_trace_for_all_uthreads())'

其中 10059486 是 cn7 的 id, 但是结果如下

Runtime error: ExecEnv metaclass does not implement 'get_stack_trace_for_all_uthreads()'.
  at: main:1

只要不重启 cn 节点, 每次卡主都是同一个cn 节点,

sql 卡住时, 我在 cn7 上 执行了

gdb -p 27 -batch -ex "thread apply all bt"

27是 cn 在 pod 中的进程 id

堆栈信息如下, 希望能有帮助

Untitled-10.stack (484.1 KB)

gdb导出的堆栈中有3 段 create_tablet 其中一段如下

Thread 659 (Thread 0x7fc446af8640 (LWP 1374) "create_tablet"):
#0  0x00007fc645b11fd9 in ?? () from /lib/x86_64-linux-gnu/libc.so.6
#1  0x00007fc645b1c24f in pthread_rwlock_wrlock () from /lib/x86_64-linux-gnu/libc.so.6
#2  0x000000000bf2ee29 in starrocks::StarOSWorker::new_shared_filesystem(std::basic_string_view<char, std::char_traits<char> >, std::unordered_map<std::__cxx11::basic_string<char, std::char_traits<char>, std::allocator<char> >, std::__cxx11::basic_string<char, std::char_traits<char>, std::allocator<char> >, std::hash<std::__cxx11::basic_string<char, std::char_traits<char>, std::allocator<char> > >, std::equal_to<std::__cxx11::basic_string<char, std::char_traits<char>, std::allocator<char> > >, std::allocator<std::pair<std::__cxx11::basic_string<char, std::char_traits<char>, std::allocator<char> > const, std::__cxx11::basic_string<char, std::char_traits<char>, std::allocator<char> > > > > const&) ()
#3  0x000000000bf30d34 in starrocks::StarOSWorker::build_filesystem_from_shard_info(staros::starlet::ShardInfo const&, std::unordered_map<std::__cxx11::basic_string<char, std::char_traits<char>, std::allocator<char> >, std::__cxx11::basic_string<char, std::char_traits<char>, std::allocator<char> >, std::hash<std::__cxx11::basic_string<char, std::char_traits<char>, std::allocator<char> > >, std::equal_to<std::__cxx11::basic_string<char, std::char_traits<char>, std::allocator<char> > >, std::allocator<std::pair<std::__cxx11::basic_string<char, std::char_traits<char>, std::allocator<char> > const, std::__cxx11::basic_string<char, std::char_traits<char>, std::allocator<char> > > > > const&) ()
#4  0x000000000bf323de in starrocks::StarOSWorker::get_shard_filesystem(unsigned long, std::unordered_map<std::__cxx11::basic_string<char, std::char_traits<char>, std::allocator<char> >, std::__cxx11::basic_string<char, std::char_traits<char>, std::allocator<char> >, std::hash<std::__cxx11::basic_string<char, std::char_traits<char>, std::allocator<char> > >, std::equal_to<std::__cxx11::basic_string<char, std::char_traits<char>, std::allocator<char> > >, std::allocator<std::pair<std::__cxx11::basic_string<char, std::char_traits<char>, std::allocator<char> > const, std::__cxx11::basic_string<char, std::char_traits<char>, std::allocator<char> > > > > const&) ()
#5  0x00000000081ee54b in starrocks::StarletFileSystem::new_writable_file(starrocks::WritableFileOptions const&, std::__cxx11::basic_string<char, std::char_traits<char>, std::allocator<char> > const&) ()
#6  0x0000000009ff27d7 in starrocks::ProtobufFile::save(google::protobuf::Message const&, bool) ()
#7  0x0000000009f8b2b6 in starrocks::lake::TabletManager::create_schema_file(long, starrocks::TabletSchemaPB const&) ()
#8  0x0000000009f8bdcf in starrocks::lake::TabletManager::create_tablet(starrocks::TCreateTabletReq const&) ()
#9  0x000000000bc76213 in starrocks::run_create_tablet_task(std::shared_ptr<starrocks::AgentTaskRequestWithReqBody<starrocks::TCreateTabletReq> > const&, starrocks::ExecEnv*) ()
#10 0x000000000c14eeab in starrocks::ThreadPool::dispatch_thread() ()
#11 0x000000000c145539 in starrocks::Thread::supervise_thread(void*) ()
#12 0x00007fc645b15ac3 in ?? () from /lib/x86_64-linux-gnu/libc.so.6
#13 0x00007fc645ba78d0 in ?? () from /lib/x86_64-linux-gnu/libc.so.6

是不是卡在 pthread_rwlock_wrlock 上了

另外我同时开启了 set enable_profile=true;
导出一份 profile 文件,
dbf6b1a8-21b9-11f1-b4be-0a9410f95593profile (2).txt (13.4 KB)

当前运行在哪个版本?

可以在gdb bt的基础上再加一下bthread stack

下载如下python script
https://raw.githubusercontent.com/apache/brpc/refs/heads/release-1.9/tools/gdb_bthread_stack.py

进入gdb后执行

source gdb_bthread_stack.py
bthread_begin
bthread_list
bthread_all
bthread_end

我目前看好像解决问题了,

先说结论:

我们的场景是: 从 3.3.22 升到 3.4.10 再升到 3.5.13 后发现的问题

集群升级过程中, 没有升级 审计插件

审计插件依然是 4.2.2 基于 jkd8 编译的.

将插件升级最新的5.0.0 基于 jdk11 编译的. 就没再复现问题. 目前一切正常了.


存算一体集群之所以没问题, 可能更 linux系统的 jdk17 版本兼容性有关

# 存算一体集群的系统版本
cat /proc/version

Linux version 5.4.17-2136.321.4.el7uek.x86_64 (mockbuild@build-ol7-x86_64.oracle.com) (gcc version 4.8.5 20150623 (Red Hat 4.8.5-39.0.3) (GCC)) #2 SMP Mon Jun 26 16:20:00 PDT 2023

# 存算一体集群的java版本
java -version

openjdk version "17.0.18" 2026-01-20
OpenJDK Runtime Environment Temurin-17.0.18+8 (build 17.0.18+8)
OpenJDK 64-Bit Server VM Temurin-17.0.18+8 (build 17.0.18+8, mixed mode, sharing)

存算分离集群的pod中的系统是

# 存算分离集群的系统版本
cat /proc/version

Linux version 5.15.0-310.184.5.2.el8uek.x86_64 (mockbuild@host-100-100-224-116) (gcc (GCC) 11.5.0 20240719 (Red Hat 11.5.0-2.0.1), GNU ld version 2.36.1-4.0.2.el8_6) #2 SMP Wed Jul 9 16:08:33 PDT 2025

# 存算分离集群的java版本
java -version

openjdk version "17.0.18" 2026-01-20
OpenJDK Runtime Environment (build 17.0.18+8-Ubuntu-122.04.1)
OpenJDK 64-Bit Server VM (build 17.0.18+8-Ubuntu-122.04.1, mixed mode, sharing)

存算分离的 jdk 与 存算一体镜像中的并不一样, 镜像中的是 build 17.0.18+8-Ubuntu-122.04.1


测试过程中为了与线上集群环境一致, 保留所有配置, 包旧的审计插件,

所以即使新建 3.5.13/ 3.5.14 的存算分离集群, 依然存在问题.


建议, 在Release Note 中, 同时加上需要同时升级 “审计插件”,

我们这确实疏忽这个东西了

昨晚审计日志升级到最新版 5.0.0 后,

EXPLAIN ANALYZE INSERT INTO ....

尝试了很多次, 以为正常了

集群空闲 (没有任何写入和查询) 超过 12 个小时后, 今天早上测试,问题又出现了, 不过有了新现象

1. 好的改变:

INSERT INTO dmp.adt_ip_country_source SELECT '2026-06-01 05:00:00','1.1.1.1','CHI','xxx';
这种每次修改时间(保证是不存在的分区), 不再报超时失败, 均可以正常执行
也可能是数据量小, 或者一次只增加了单个分区, 后面会继续测试一下

2. 依然存的问题: 如下语句依然会卡主

EXPLAIN ANALYZE INSERT INTO dmp.adt_ip_country_source(__dt,ip,country,source) SELECT DATE_ADD('2026-04-05 00:00:00', INTERVAL d hour),'','','' FROM table(generate_series(0, 23)) AS g(d);

进入对应的 cn 节点pod,
下载了
https://raw.githubusercontent.com/apache/brpc/refs/heads/release-1.9/tools/gdb_bthread_stack.py

root@starrocks-cn-4:/opt/starrocks# ps -ef|grep cn
root           1       0  0 Mar17 ?        00:00:00 /bin/bash /opt/starrocks/cn_entrypoint.sh starrocks-fe-service
root          72       1  2 Mar17 ?        00:25:10 /opt/starrocks/cn/lib/starrocks_be --cn
root       11993   11973  0 03:57 pts/0    00:00:00 grep --color=auto cn
root@starrocks-cn-4:/opt/starrocks# https://raw.githubusercontent.com/apache/brpc/refs/heads/release-1.9/tools/gdb_bthread_stack.py

^C
root@starrocks-cn-4:/opt/starrocks# curl -O https://raw.githubusercontent.com/apache/brpc/refs/heads/release-1.9/tools/gdb_bthread_stack.py

  % Total    % Received % Xferd  Average Speed   Time    Time     Time  Current
                                 Dload  Upload   Total   Spent    Left  Speed
100 12374  100 12374    0     0  66277      0 --:--:-- --:--:-- --:--:-- 66526
root@starrocks-cn-4:/opt/starrocks# l
LICENSE.txt  NOTICE.txt  be/  be_entrypoint.sh*  be_prestop.sh*  cn@  cn_entrypoint.sh*  cn_prestop.sh*  gdb_bthread_stack.py  upload_coredump.sh*
root@starrocks-cn-4:/opt/starrocks# gdb
GNU gdb (Ubuntu 12.1-0ubuntu1~22.04.2) 12.1
Copyright (C) 2022 Free Software Foundation, Inc.
License GPLv3+: GNU GPL version 3 or later <http://gnu.org/licenses/gpl.html>
This is free software: you are free to change and redistribute it.
There is NO WARRANTY, to the extent permitted by law.
Type "show copying" and "show warranty" for details.
This GDB was configured as "x86_64-linux-gnu".
Type "show configuration" for configuration details.
For bug reporting instructions, please see:
<https://www.gnu.org/software/gdb/bugs/>.
Find the GDB manual and other documentation resources online at:
    <http://www.gnu.org/software/gdb/documentation/>.

For help, type "help".
Type "apropos word" to search for commands related to "word".
(gdb) attach 72
Attaching to process 72
[New LWP 190]
[New LWP 191]
[New LWP 192]
[New LWP 193]
[New LWP 194]
[New LWP 195]
[New LWP 196]
[New LWP 197]
[New LWP 198]
[New LWP 199]
[New LWP 200]
.
.此处日志省略
.
[New LWP 11881]
[New LWP 11963]
[Thread debugging using libthread_db enabled]
Using host libthread_db library "/lib/x86_64-linux-gnu/libthread_db.so.1".
0x00007fc883e067f8 in clock_nanosleep () from /lib/x86_64-linux-gnu/libc.so.6
(gdb) bthread_begin
Undefined command: "bthread_begin".  Try "help".
(gdb) source gdb_bthread_stack.py
(gdb) bthread_begin
Python Exception <class 'gdb.error'>: No symbol "bthread" in current context.
Error occurred in Python: No symbol "bthread" in current context.
(gdb) bthread_list
Not in bthread debug mode
(gdb) bthread_all
Not in bthread debug mode
(gdb) bthread_end
Not in bthread debug mode
(gdb)

当开启 bthread_begin 后,
命令报错Error occurred in Python: No symbol "bthread" in current context.
中 从k9s 上能看到 cn pod 挂掉 重启,

JDK版本是跟着image走的. 3.5+用JDK17, 3.5之前用JDK11

这个需要把对应的Debuginfo也放到POD里, 才能拿到完整的debuginfo.

我尝试 debuginfo 放入到 cn 上, 执行 gdb 后, 会导致 cn pod 重启, 无法导出堆栈信息

  • 过程如下

# 进入到 cn 的 pod 中, 执行如下命令

ps -ef|grep cn

curl -O https://raw.githubusercontent.com/apache/brpc/refs/heads/release-1.9/tools/gdb_bthread_stack.py

curl -O https://releases.starrocks.io/starrocks/StarRocks-3.5.14-ubuntu-amd64.debuginfo.tar.gz

tar -xzvf StarRocks-3.5.14-ubuntu-amd64.debuginfo.tar.gz

mv starrocks_be.debuginfo /opt/starrocks/cn/lib/

# 其中 ${cn_pid} 是 ps 出来的 cn 的 pid

gdb attach ${cn_pid}

  • cn 节点是 16 核 64G 内存, cn pod 因 gdb 重启时, 没发现资源不足的问题

目前有新的测试进展

  • 新建 3.5.14 存算分离集群

  • 创建 2 个 STORAGE VOLUME ,

  • 一个基于 s3, 命名为: volume_s3

  • 一个基于 hdfs, 命名为: volume_hdfs (hadoop集群版本是 3.1.1 )

  • 默认 STORAGE VOLUME 是使用的 s3

  • 不安装审计插件

  • 测试业务表 adt_ip_country_source 小时及分区

CREATE DATABASE dmp;
DROP TABLE dmp.adt_ip_country_source_hdfs force;
CREATE TABLE dmp.adt_ip_country_source_hdfs (
  `__dt` datetime NOT NULL COMMENT "数据时间,精确到小时",
  `ip` varchar(50) NOT NULL COMMENT "ip",
  `country` varchar(3) NOT NULL COMMENT "国家",
  `source` varchar(16) NOT NULL COMMENT "IP 来源"
) ENGINE=OLAP
PARTITION BY date_trunc('hour', __dt)
DISTRIBUTED BY HASH(`ip`, `country`) BUCKETS 1
PROPERTIES (
"compression" = "LZ4",
"datacache.enable" = "true",
"datacache.partition_duration" = "1 days",
"enable_async_write_back" = "false",
"partition_live_number" = "840",
"replication_num" = "1",
"storage_volume" = "volume_hdfs"
);

  • 测试语句 共 2.5 个月的分区, 每天(24 个小时分区)一个语句, 顺序执行

EXPLAIN ANALYZE INSERT INTO dmp.adt_ip_country_source(__dt,ip,country,source) SELECT DATE_ADD('2026-01-01 00:00:00', INTERVAL d hour),'','','' FROM table(generate_series(0, 23)) AS g(d);

...

EXPLAIN ANALYZE INSERT INTO dmp.adt_ip_country_source(__dt,ip,country,source) SELECT DATE_ADD('2026-03-10 00:00:00', INTERVAL d hour),'','','' FROM table(generate_series(0, 23)) AS g(d);

场景一,

  • 创建业务表 adt_ip_country_source 时使用 volume_s3 作为底层存储

  • 测试 3 轮, 每轮测试前删除并重建表

一切正常

场景二,

  • 创建业务表 adt_ip_country_source 时使用 volume_hdfs 作为底层存储

测试过程中, 一般在 20 几条语句执行后, 就触发卡主的问题

场景三,

SR 3.4.10(版本没出问题)中 hadoop 相关 jar 的版本是 3.4.1
SR 3.5.9 中的 hadoop 相关 jar 的版本是 3.4.1
SR 3.5.10/11/12/13 中的 hadoop 相关 jar 的版本是 3.4.2
SR 3.5.14 中的 hadoop 相关 jar 的版本是 3.4.3

  • 于是从 3.5.14 降级到 SR 3.5.9

  • 创建业务表 adt_ip_country_source 时使用 volume_hdfs 作为底层存储

  • 测试 3 轮, 每轮测试前删除并重建表

一切正常

场景四,

  • 在SR 3.5.9 基础上, 升级到 3.5.14

测试过程中, 在 10 几条语句执行后, 就触发卡主的问题

  • 最开始就是在 3.5.13 报的错, 由于他hadoop 相关 jar 的版本是 3.4.2,
    所以 3.5.10 ~ 13 这个几个版就没在复测了

到此初步判断

1. 怀疑 hadoop 3.4.3 客户端 对 jdk17 兼容问题

2. 怀疑 SR 升级 hadoop 3.4.3 客户端后, 有其他问题


3. 怀疑 hadoop 3.4.3 客户端 对 我们这 hadoop 3.1.1集群访问 有兼容问题(这个应该不太可能)

像是hdfs走JNI与bthread有一些冲突, 导致死锁. 如果能gcore CN进程后离线分析也行, gdb解析debuginfo确实容易导致POD memory超标被杀.

导出了一份堆栈, 您帮看看是否有用

操作过程

curl -O https://releases.starrocks.io/starrocks/StarRocks-3.5.14-ubuntu-amd64.debuginfo.tar.gz
tar -xzvf  StarRocks-3.5.14-ubuntu-amd64.debuginfo.tar.gz
mv starrocks_be.debuginfo  /opt/starrocks/cn/lib/

# 得到 pid 为 27
ps -ef|grep cn

# 额外挂了一个pv到 /data目录 防止重启 pod 导致 pv 消失
cd /data
gcore -o starrocks_be_core 27

  • 使用 gdb分析 gcore 文件, 查看 LWP 为 443 对应的的 GDB 线程号, 得到 gdb 线程号为 252
gdb /opt/starrocks/cn/lib/starrocks_be starrocks_be_core.27

info threads

.
.
.
  250  Thread 0x7f55b3e9c640 (LWP 441)  0x00007f563701a117 in ?? () from /lib/x86_64-linux-gnu/libc.so.6
  251  Thread 0x7f55b369b640 (LWP 442)  0x00007f563701a117 in ?? () from /lib/x86_64-linux-gnu/libc.so.6
  252  Thread 0x7f55b2e9a640 (LWP 443)  0x00007f56372dbdae in rtree_leafkey (key=<optimized out>) at include/jemalloc/internal/rtree.h:148
  253  Thread 0x7f55b2699640 (LWP 444)  0x00007f563701a117 in ?? () from /lib/x86_64-linux-gnu/libc.so.6
  254  Thread 0x7f55b1e98640 (LWP 445)  0x00007f563701a117 in ?? () from /lib/x86_64-linux-gnu/libc.so.6
  255  Thread 0x7f55b1697640 (LWP 446)  0x00007f563701a117 in ?? () from /lib/x86_64-linux-gnu/libc.so.6
  256  Thread 0x7f55b0e96640 (LWP 447)  0x00007f563701a117 in ?? () from /lib/x86_64-linux-gnu/libc.so.6

  • 对gdb 线程号为 252的线程分析
(gdb)
(gdb) t 252
[Switching to thread 252 (Thread 0x7f55b2e9a640 (LWP 443))]
#0  0x00007f56372dbdae in rtree_leafkey (key=<optimized out>) at include/jemalloc/internal/rtree.h:148
148	include/jemalloc/internal/rtree.h: No such file or directory.
(gdb) bt
#0  0x00007f56372dbdae in rtree_leafkey (key=<optimized out>) at include/jemalloc/internal/rtree.h:148
#1  rtree_leaf_elm_lookup_fast (elm=<synthetic pointer>, key=140002879523872, rtree_ctx=<optimized out>, rtree=<optimized out>, tsdn=<optimized out>) at include/jemalloc/internal/rtree.h:341
#2  rtree_metadata_try_read_fast (tsdn=<optimized out>, rtree=<optimized out>, rtree_ctx=<optimized out>, r_rtree_metadata=<synthetic pointer>, key=140002879523872) at include/jemalloc/internal/rtree.h:463
#3  emap_alloc_ctx_try_lookup_fast (alloc_ctx=<synthetic pointer>, ptr=0x7f54f5e6cc20, emap=<optimized out>, tsd=<optimized out>) at include/jemalloc/internal/emap.h:290
#4  free_fastpath (size_hint=false, size=0, ptr=0x7f54f5e6cc20) at src/jemalloc.c:3081
#5  jefree (ptr=0x7f54f5e6cc20) at src/jemalloc.c:3161
#6  0x000000000bd6592e in std::_Function_base::_Base_manager<starrocks::TabletSinkSender::try_close(starrocks::RuntimeState*)::<lambda(starrocks::NodeChannel*)> >::_M_destroy (__victim=...) at /usr/include/c++/11/bits/std_function.h:175
#7  std::_Function_base::_Base_manager<starrocks::TabletSinkSender::try_close(starrocks::RuntimeState*)::<lambda(starrocks::NodeChannel*)> >::_M_manager (__op=<optimized out>, __source=..., __dest=...) at /usr/include/c++/11/bits/std_function.h:203
#8  std::_Function_handler<void(starrocks::NodeChannel*), starrocks::TabletSinkSender::try_close(starrocks::RuntimeState*)::<lambda(starrocks::NodeChannel*)> >::_M_manager(std::_Any_data &, const std::_Any_data &, std::_Manager_operation) (__dest=...,
    __source=..., __op=<optimized out>) at /usr/include/c++/11/bits/std_function.h:282
#9  0x000000000bd676b0 in std::_Function_base::~_Function_base (this=0x7f55b2e8a5d0, __in_chrg=<optimized out>) at /usr/include/c++/11/bits/std_function.h:244
#10 std::function<void (starrocks::NodeChannel*)>::~function() (this=0x7f55b2e8a5d0, __in_chrg=<optimized out>) at /usr/include/c++/11/bits/std_function.h:334
#11 starrocks::TabletSinkSender::try_close (this=<optimized out>, state=<optimized out>) at be/src/exec/tablet_sink_sender.cpp:246
#12 0x000000000bd2774c in starrocks::OlapTableSink::try_close (state=<optimized out>, this=<optimized out>) at be/src/exec/tablet_sink.h:84
#13 starrocks::pipeline::OlapTableSinkOperator::pending_finish (this=0x7f5560304610) at be/src/exec/pipeline/olap_table_sink_operator.cpp:83
#14 0x000000000bc08195 in starrocks::pipeline::PipelineDriver::is_still_pending_finish (this=0x7f5560305210) at be/src/exec/pipeline/pipeline_driver.h:349
#15 starrocks::pipeline::PipelineDriver::is_still_pending_finish (this=0x7f5560305210) at be/src/exec/pipeline/pipeline_driver.h:349
#16 starrocks::pipeline::PipelineDriverPoller::run_internal (this=0x7f5630897180) at be/src/exec/pipeline/pipeline_driver_poller.cpp:113
#17 0x000000000c145539 in std::function<void ()>::operator()() const (this=0x7f5630896a18) at /usr/include/c++/11/bits/std_function.h:590
#18 starrocks::Thread::supervise_thread (arg=0x7f5630896a00) at be/src/util/thread.cpp:366
#19 0x00007f563701dac3 in ?? () from /lib/x86_64-linux-gnu/libc.so.6
#20 0x00007f56370af8d0 in ?? () from /lib/x86_64-linux-gnu/libc.so.6
  • 对gdb 线程号为 252的线程分析 disassemble $pc
(gdb) thread 252
[Switching to thread 252 (Thread 0x7f55b2e9a640 (LWP 443))]
#0  0x00007f56372dbdae in rtree_leafkey (key=<optimized out>) at include/jemalloc/internal/rtree.h:148
148	include/jemalloc/internal/rtree.h: No such file or directory.
(gdb) disassemble $pc
Dump of assembler code for function jefree:
   0x00007f56372dbda0 <+0>:	endbr64
   0x00007f56372dbda4 <+4>:	mov    %rdi,%rax
   0x00007f56372dbda7 <+7>:	mov    0xb01d2(%rip),%rcx        # 0x7f563738bf80
=> 0x00007f56372dbdae <+14>:	mov    %rdi,%rdx
   0x00007f56372dbdb1 <+17>:	shr    $0x17,%rax
   0x00007f56372dbdb5 <+21>:	and    $0xfffffffff8000000,%rdx
   0x00007f56372dbdbc <+28>:	and    $0xf0,%eax
   0x00007f56372dbdc1 <+33>:	add    %fs:0x0,%rax
   0x00007f56372dbdca <+42>:	add    %rcx,%rax
   0x00007f56372dbdcd <+45>:	cmp    0x1b0(%rax),%rdx
   0x00007f56372dbdd4 <+52>:	jne    0x7f56372dbe60 <jefree+192>
   0x00007f56372dbdda <+58>:	mov    %rdi,%rsi
   0x00007f56372dbddd <+61>:	shr    $0x8,%rsi
   0x00007f56372dbde1 <+65>:	and    $0x7fff0,%esi
   0x00007f56372dbde7 <+71>:	add    0x1b8(%rax),%rsi
   0x00007f56372dbdee <+78>:	mov    0x8(%rsi),%r9d
   0x00007f56372dbdf2 <+82>:	mov    (%rsi),%rax
   0x00007f56372dbdf5 <+85>:	mov    %r9d,%r10d
   0x00007f56372dbdf8 <+88>:	shr    $0x5,%r10d
   0x00007f56372dbdfc <+92>:	and    $0x1,%r9d
   0x00007f56372dbe00 <+96>:	je     0x7f56372dbe60 <jefree+192>
   0x00007f56372dbe02 <+98>:	lea    0x10ec77(%rip),%rax        # 0x7f56373eaa80 <je_sz_index2size_tab>
   0x00007f56372dbe09 <+105>:	mov    %r10d,%r11d
   0x00007f56372dbe0c <+108>:	mov    (%rax,%r11,8),%rdx
   0x00007f56372dbe10 <+112>:	add    %fs:0x348(%rcx),%rdx
   0x00007f56372dbe18 <+120>:	cmp    %rdx,%fs:0x350(%rcx)
   0x00007f56372dbe20 <+128>:	jbe    0x7f56372dbe60 <jefree+192>
   0x00007f56372dbe22 <+130>:	mov    %fs:0x0,%r8
   0x00007f56372dbe2b <+139>:	lea    (%r11,%r11,2),%rsi
   0x00007f56372dbe2f <+143>:	lea    (%r8,%rsi,8),%r9
   0x00007f56372dbe33 <+147>:	add    %rcx,%r9
   0x00007f56372dbe36 <+150>:	mov    0x360(%r9),%r10
   0x00007f56372dbe3d <+157>:	cmp    %r10w,0x372(%r9)
   0x00007f56372dbe45 <+165>:	je     0x7f56372dbe60 <jefree+192>
   0x00007f56372dbe47 <+167>:	lea    -0x8(%r10),%r11
   0x00007f56372dbe4b <+171>:	mov    %r11,0x360(%r9)
   0x00007f56372dbe52 <+178>:	mov    %rdi,-0x8(%r10)
   0x00007f56372dbe56 <+182>:	mov    %rdx,%fs:0x348(%rcx)
   0x00007f56372dbe5e <+190>:	ret
   0x00007f56372dbe5f <+191>:	nop
   0x00007f56372dbe60 <+192>:	jmp    0x7f56372daca0 <je_free_default>
End of assembler dump.
  • 对gdb 线程号为 252的寄存器状态
(gdb)  t 252
[Switching to thread 252 (Thread 0x7f55b2e9a640 (LWP 443))]
#0  0x00007f56372dbdae in rtree_leafkey (key=<optimized out>) at include/jemalloc/internal/rtree.h:148
148	in include/jemalloc/internal/rtree.h
(gdb) info registers
rax            0x7f54f5e6cc20      140002879523872
rbx            0x7f55b2e8a5d0      140006050538960
rcx            0xffffffffffff0a70  -62864
rdx            0x1197bd50          295157072
rsi            0x7f54f0000000      140002780512256
rdi            0x7f54f5e6cc20      140002879523872
rbp            0x7f55b2e8a570      0x7f55b2e8a570
rsp            0x7f55b2e8a558      0x7f55b2e8a558
r8             0x7f556092fd50      140004669193552
r9             0x0                 0
r10            0x7f56373eaa80      140008270768768
r11            0x7f55b2e9a640      140006050604608
r12            0x7f556079ec10      140004667550736
r13            0x7f556092fd40      140004669193536
r14            0x7f55b2e8a5c0      140006050538944
r15            0x7f55b2e8a5d0      140006050538960
rip            0x7f56372dbdae      0x7f56372dbdae <jefree+14>
eflags         0x206               [ PF IF ]
cs             0x33                51
ss             0x2b                43
ds             0x0                 0
es             0x0                 0
fs             0x0                 0
gs             0x0                 0

那个是polling线程, 会打满的, 3.5开始支持event scheduling, 避免这种单线程轮询打满的场景.

gdb core之后还是要看一下bthread那些, 看看能拿到哪些bthread信息.

通过 gdb_bthread_stack.py 得到结果如下

[Current thread is 1 (Thread 0x7f5636d36cc0 (LWP 27))]
(gdb) source gdb_bthread_stack.py
(gdb) bthread_begin
Active bthreads: 6, will display 6 bthreads
Enter bthread debug mode, do not switch thread before exec 'bthread_end' !!!
(gdb) bthread_list
id		tid		function		has stack			total:6
#0		4294969344		0xbde0340 <starrocks::LoadChannelMgr::load_channel_clean_bg_worker(void*)>		yes
#1		4294969345		0x102a9a70 <brpc::GlobalUpdate(void*)>		yes
#2		4294969346		0x102a86f0 <brpc::EventDispatcher::RunThis(void*)>		yes
#3		4294969347		0x102d3b00 <brpc::Server::UpdateDerivedVars(void*)>		yes
#4		4294971904		0x103007c0 <brpc::SocketMap::RunWatchConnections(void*)>		yes
#5		8589940498		0x102f2690 <brpc::Socket::ProcessEvent(void*)>		yes
(gdb) bthread_all
# 得到的是空

导出 thread apply all bt 的信息 , 请查看附件thread_bt.log (674.5 KB)

在 gdb 环境下导出操作如下

set logging file filtered.log
set logging enabled on
set pagination off
thread apply all bt
set logging enabled off
set pagination on

bthread_list 中的 starrocks::LoadChannelMgr 对应的 bt

Thread 533 (Thread 0x7f5515f39640 (LWP 726)):

#0  0x00007f5637019fd9 in ?? () from /lib/x86_64-linux-gnu/libc.so.6
#1  0x00007f563702424f in pthread_rwlock_wrlock () from /lib/x86_64-linux-gnu/libc.so.6
#2  0x000000000bf2ee29 in std::__glibcxx_rwlock_wrlock (__rwlock=0x7f563099f220) at /usr/include/c++/11/shared_mutex:80
#3  std::__shared_mutex_pthread::lock (this=0x7f563099f220) at /usr/include/c++/11/shared_mutex:193
#4  std::shared_mutex::lock (this=0x7f563099f220) at /usr/include/c++/11/shared_mutex:420
#5  std::unique_lock<std::shared_mutex>::lock (this=<synthetic pointer>) at /usr/include/c++/11/bits/unique_lock.h:139
#6  std::unique_lock<std::shared_mutex>::unique_lock (__m=..., this=<synthetic pointer>) at /usr/include/c++/11/bits/unique_lock.h:69
#7  starrocks::StarOSWorker::new_shared_filesystem (this=this@entry=0x7f563099f190, scheme=..., conf=std::unordered_map with 8 elements = {...}) at be/src/service/staros_worker.cpp:364
#8  0x000000000bf30d34 in starrocks::StarOSWorker::build_filesystem_from_shard_info (this=this@entry=0x7f563099f190, info=..., conf=std::unordered_map with 0 elements) at /usr/include/c++/11/string_view:137
#9  0x000000000bf323de in starrocks::StarOSWorker::get_shard_filesystem (this=0x7f563099f190, id=67051, conf=std::unordered_map with 0 elements) at be/src/service/staros_worker.cpp:239
#10 0x00000000081ead1c in starrocks::StarletFileSystem::get_shard_filesystem (shard_id=<optimized out>, this=0x7f5625291240) at /usr/include/c++/11/bits/shared_ptr_base.h:1295
#11 starrocks::StarletFileSystem::delete_dir (this=0x7f5625291240, dirname=...) at be/src/fs/fs_starlet.cpp:467
#12 0x000000000a7deb31 in starrocks::lake::LoadSpillBlockManager::clear_parent_path (this=this@entry=0x7f5625310540) at be/src/storage/lake/load_spill_block_manager.cpp:103
#13 0x000000000a7df033 in starrocks::lake::LoadSpillBlockManager::~LoadSpillBlockManager (this=this@entry=0x7f5625310540, __in_chrg=<optimized out>) at be/src/storage/lake/load_spill_block_manager.cpp:90
#14 0x000000000bcaa96f in std::default_delete<starrocks::lake::LoadSpillBlockManager>::operator() (__ptr=0x7f5625310540, this=<optimized out>) at /usr/include/c++/11/bits/unique_ptr.h:85
#15 std::unique_ptr<starrocks::lake::LoadSpillBlockManager, std::default_delete<starrocks::lake::LoadSpillBlockManager> >::~unique_ptr (this=0x7f562fb92900, __in_chrg=<optimized out>) at /usr/include/c++/11/bits/unique_ptr.h:361
#16 starrocks::lake::DeltaWriterImpl::~DeltaWriterImpl (this=0x7f562fb92780, __in_chrg=<optimized out>) at be/src/storage/lake/delta_writer.cpp:106
#17 starrocks::lake::DeltaWriter::~DeltaWriter (this=<optimized out>, __in_chrg=<optimized out>) at be/src/storage/lake/delta_writer.cpp:822
#18 0x000000000bef9cab in std::default_delete<starrocks::lake::DeltaWriter>::operator() (__ptr=0x7f55114522e8, this=<optimized out>) at /usr/include/c++/11/bits/unique_ptr.h:79
#19 std::unique_ptr<starrocks::lake::DeltaWriter, std::default_delete<starrocks::lake::DeltaWriter> >::~unique_ptr (this=0x7f54f929cd80, __in_chrg=<optimized out>) at /usr/include/c++/11/bits/unique_ptr.h:361
#20 starrocks::lake::AsyncDeltaWriterImpl::~AsyncDeltaWriterImpl (this=0x7f54f929cd80, __in_chrg=<optimized out>) at be/src/storage/lake/async_delta_writer.cpp:137
#21 starrocks::lake::AsyncDeltaWriter::~AsyncDeltaWriter (this=<optimized out>, __in_chrg=<optimized out>) at be/src/storage/lake/async_delta_writer.cpp:367
#22 0x000000000beee5b8 in std::default_delete<starrocks::lake::AsyncDeltaWriter>::operator() (__ptr=0x7f55114522f8, this=<optimized out>) at /usr/include/c++/11/bits/unique_ptr.h:79
#23 std::unique_ptr<starrocks::lake::AsyncDeltaWriter, std::default_delete<starrocks::lake::AsyncDeltaWriter> >::~unique_ptr (this=0x7f54eb48e530, __in_chrg=<optimized out>) at /usr/include/c++/11/bits/unique_ptr.h:361
#24 std::pair<long const, std::unique_ptr<starrocks::lake::AsyncDeltaWriter, std::default_delete<starrocks::lake::AsyncDeltaWriter> > >::~pair (this=0x7f54eb48e528, __in_chrg=<optimized out>) at /usr/include/c++/11/bits/stl_pair.h:211
#25 std::destroy_at<std::pair<long const, std::unique_ptr<starrocks::lake::AsyncDeltaWriter, std::default_delete<starrocks::lake::AsyncDeltaWriter> > > > (__location=0x7f54eb48e528) at /usr/include/c++/11/bits/stl_construct.h:88
#26 std::allocator_traits<std::allocator<std::__detail::_Hash_node<std::pair<long const, std::unique_ptr<starrocks::lake::AsyncDeltaWriter, std::default_delete<starrocks::lake::AsyncDeltaWriter> > >, false> > >::destroy<std::pair<long const, std::unique_ptr<starrocks::lake::AsyncDeltaWriter, std::default_delete<starrocks::lake::AsyncDeltaWriter> > > > (__p=0x7f54eb48e528, __a=...) at /usr/include/c++/11/bits/alloc_traits.h:537
#27 std::__detail::_Hashtable_alloc<std::allocator<std::__detail::_Hash_node<std::pair<long const, std::unique_ptr<starrocks::lake::AsyncDeltaWriter, std::default_delete<starrocks::lake::AsyncDeltaWriter> > >, false> > >::_M_deallocate_node (__n=0x7f54eb48e520, this=<optimized out>) at /usr/include/c++/11/bits/hashtable_policy.h:1894
#28 std::__detail::_Hashtable_alloc<std::allocator<std::__detail::_Hash_node<std::pair<long const, std::unique_ptr<starrocks::lake::AsyncDeltaWriter, std::default_delete<starrocks::lake::AsyncDeltaWriter> > >, false> > >::_M_deallocate_nodes (this=<optimized out>, __n=0x7f54eb48e5c0) at /usr/include/c++/11/bits/hashtable_policy.h:1916
#29 std::_Hashtable<long, std::pair<long const, std::unique_ptr<starrocks::lake::AsyncDeltaWriter, std::default_delete<starrocks::lake::AsyncDeltaWriter> > >, std::allocator<std::pair<long const, std::unique_ptr<starrocks::lake::AsyncDeltaWriter, std::default_delete<starrocks::lake::AsyncDeltaWriter> > > >, std::__detail::_Select1st, std::equal_to<long>, std::hash<long>, std::__detail::_Mod_range_hashing, std::__detail::_Default_ranged_hash, std::__detail::_Prime_rehash_policy, std::__detail::_Hashtable_traits<false, false, true> >::clear (this=0x7f55114477b8) at /usr/include/c++/11/bits/hashtable.h:2320
#30 std::_Hashtable<long, std::pair<long const, std::unique_ptr<starrocks::lake::AsyncDeltaWriter, std::default_delete<starrocks::lake::AsyncDeltaWriter> > >, std::allocator<std::pair<long const, std::unique_ptr<starrocks::lake::AsyncDeltaWriter, std::default_delete<starrocks::lake::AsyncDeltaWriter> > > >, std::__detail::_Select1st, std::equal_to<long>, std::hash<long>, std::__detail::_Mod_range_hashing, std::__detail::_Default_ranged_hash, std::__detail::_Prime_rehash_policy, std::__detail::_Hashtable_traits<false, false, true> >::~_Hashtable (this=0x7f55114477b8, __in_chrg=<optimized out>) at /usr/include/c++/11/bits/hashtable.h:1532
#31 std::unordered_map<long, std::unique_ptr<starrocks::lake::AsyncDeltaWriter, std::default_delete<starrocks::lake::AsyncDeltaWriter> >, std::hash<long>, std::equal_to<long>, std::allocator<std::pair<long const, std::unique_ptr<starrocks::lake::AsyncDeltaWriter, std::default_delete<starrocks::lake::AsyncDeltaWriter> > > > >::~unordered_map (this=0x7f55114477b8, __in_chrg=<optimized out>) at /usr/include/c++/11/bits/unordered_map.h:102
#32 starrocks::LakeTabletsChannel::DeltaWritersImpl::~DeltaWritersImpl (this=0x7f55114477b8, __in_chrg=<optimized out>) at be/src/runtime/lake_tablets_channel.cpp:229
#33 starrocks::LakeTabletsChannel::~LakeTabletsChannel (this=0x7f5511447510, __in_chrg=<optimized out>) at be/src/runtime/lake_tablets_channel.cpp:332
#34 0x0000000008103d3a in std::_Sp_counted_base<(__gnu_cxx::_Lock_policy)2>::_M_release (this=0x7f5511447500) at /usr/include/c++/11/bits/shared_ptr_base.h:168
#35 std::_Sp_counted_base<(__gnu_cxx::_Lock_policy)2>::_M_release (this=0x7f5511447500) at /usr/include/c++/11/bits/shared_ptr_base.h:161
#36 0x000000000bdea345 in std::__shared_count<(__gnu_cxx::_Lock_policy)2>::~__shared_count (this=0x7f54e4667798, __in_chrg=<optimized out>) at /usr/include/c++/11/bits/shared_ptr_base.h:705
#37 std::__shared_ptr<starrocks::TabletsChannel, (__gnu_cxx::_Lock_policy)2>::~__shared_ptr (this=0x7f54e4667790, __in_chrg=<optimized out>) at /usr/include/c++/11/bits/shared_ptr_base.h:1154
#38 std::shared_ptr<starrocks::TabletsChannel>::~shared_ptr (this=0x7f54e4667790, __in_chrg=<optimized out>) at /usr/include/c++/11/bits/shared_ptr.h:122
#39 starrocks::LoadChannel::_add_chunk (this=this@entry=0x7f54f6c8d400, chunk=chunk@entry=0x7f562fb6fa80, watch=watch@entry=0x7f54e4667920, request=..., response=response@entry=0x7f562c94f220) at be/src/runtime/load_channel.cpp:195
#40 0x000000000bdeb545 in starrocks::LoadChannel::add_chunks (this=0x7f54f6c8d400, req=..., response=0x7f562c94f220) at be/src/runtime/load_channel.cpp:243
#41 0x000000000bddf054 in starrocks::LoadChannelMgr::add_chunks (this=0x7f56308ea000, request=..., response=0x7f562c94f220) at be/src/runtime/load_channel_mgr.cpp:247
#42 0x000000000bfafb41 in starrocks::BackendInternalServiceImpl<starrocks::PInternalService>::tablet_writer_add_chunks (this=<optimized out>, cntl_base=<optimized out>, request=<optimized out>, response=<optimized out>, done=0x7f54ea977630) at be/src/service/service_be/internal_service.cpp:96
#43 0x000000001038f253 in brpc::policy::ProcessRpcRequest (msg_base=0x7f54f6a32640) at /usr/include/c++/11/bits/unique_ptr.h:185
#44 0x00000000102b493b in brpc::ProcessInputMessage (void_arg=<optimized out>) at src/brpc/input_messenger.cpp:173
#45 0x00000000102b5d84 in brpc::InputMessenger::OnNewMessages (m=0x7f54f8abe180) at src/brpc/input_messenger.cpp:397
#46 0x00000000102f26a2 in brpc::Socket::ProcessEvent (arg=0x7f54f8abe180) at src/brpc/socket.cpp:1201
#47 0x0000000010269837 in bthread::TaskGroup::task_runner (skip_remained=<optimized out>) at src/bthread/task_group.cpp:305
#48 0x0000000010252821 in bthread_make_fcontext ()
#49 0x0000000000000000 in ?? ()

番外

1. 豆包对 thread apply all bt 导出的堆栈文件分析结果.

image

2. deepseek hread apply all bt 导出的堆栈文件分析结果

image

3. 千问 hread apply all bt 导出的堆栈文件分析结果

4. cursor 分析结果

5. chatgpt 比较弱, 没给出有用回答(我没付费)

1赞

可能相关的是bthread #0 和bthread #5

方不方便将core file share出来, 我们仔细研究研究.