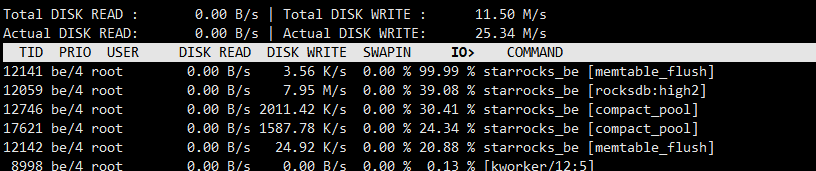
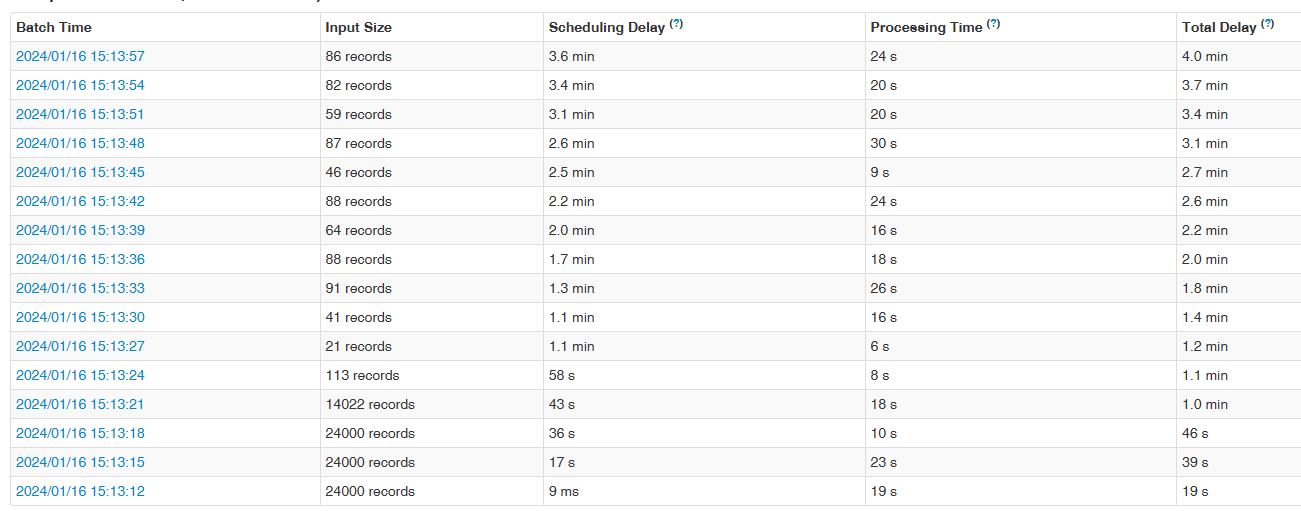
【详述】streamLoad很慢,1条数据需要操作5~6s,导致实时流写入不可用,不知道streamLoad如何开启profile,使用insert into 排查问题
【背景】做过哪些操作?
【业务影响】
【是否存算分离】
【StarRocks版本】例如:3.0.7
【集群规模】测试环境(fe与be混部)
【表模型】聚合模型,场景约等于主键模型
【导入或者导出方式】streamLoad
【附件】
Query:
Summary:
- Query ID: e22f548f-b367-11ee-9c4f-005056ad08a8
- Start Time: 2024-01-15 13:35:25
- End Time: 2024-01-15 13:35:35
- Total: 10s561ms
- Query Type: Query
- Query State: OK
- StarRocks Version: 3.0.7-208c9db
- User: root
- Default Db: demo
- Sql Statement: /* ApplicationName=DBeaver 7.3.1 - SQLEditor <Script-351.sql> */ INSERT INTO demo.table_tm_fuel_demo_recently
(device_sn, data_time, recv_time, save_time, device_no, obdx_urea_cost, obdx_urea_inst_cost, obdx_dpf_egt, obdx_instant_fuel, obdx_engine_time, obdx_smoke_meter_state, obdx_pm_consistence, obdx_kvalue, obdx_opacity, login_type, login_order_num, login_sim_iccid, gps_fix_state, gps_latitude, gps_longitude, gps_altitude, gps_speed, gps_mileage, gps_oil_cost, gps_rev, gps_dir, gps_oil__percent, gps_running_time, gps_working_time, gps_longitude_gcj102, gps_latitude_gcj102, gps_longitude_bd09, gps_latitude_bd09, obd_detect_protocol, obd_mil_state, obd_detect_state, obd_detect_ready_state, obd_indentify_code, obd_id_version, obd_calibrate_verifiy, obd_iupr, obd_error_code_count, obd_list_error_code, df_oil_percent, df_air_input, df_atmo_pres, df_rev, df_dpf_different_press, df_upper_scr_nox_output, df_latitude, df_temper_coolant, df_down_scr_nox_outPut, df_speed, df_output_wrest, df_fix_state, df_temper_scr_output, df_rub_wrest, df_percent_reactant, df_temper_scr_input, df_fuel_velocity_flow, df_longitude, df_mileage, obdx_torque_mode, obdx_acc_pedal, obdx_oil_cost, obdx_urea_temper)
VALUES(‘xbtest’, ‘2024-01-12 09:02:38’, ‘2024-01-12 09:02:40’, ‘2024-01-12 09:06:34.646000000’, NULL, NULL, NULL, NULL, NULL, NULL, NULL, NULL, NULL, NULL, 2, 3, ‘89860621180001641810’, 3, 30.148159000, 120.087539000, 25.000000000, 45.900000000, 16599.100000000, 10568.500000000, 65535.000000000, 80, 98.000000000, 2147483647, 4294967295, 120.092346000, 30.145879000, 120.098854000, 30.151928000, 1.000000000, 0.000000000, 57067.000000000, 0.000000000, ‘LZ5N2CE52PB001351’, ‘HM09P370P185764000’, ‘9E1D71A630303030303030303030303030’, ‘005A00B00002000E004E005A00000000008D00040032005A000000000012005A007C00’, 0, ‘[570521324]’, 98.400000000, 215.200000000, 102.000000000, 712.500000000, 0.600000000, 245.000000000, 30.148401000, 83.000000000, 4.750000000, 10.391000000, 7.000000000, 0, 315.125000000, 5.000000000, 85.200000000, 329.718750000, 1.800000000, 120.088877000, 16599.200000000, NULL, NULL, NULL, NULL)
 - Variables: parallel_fragment_exec_instance_num=1,max_parallel_scan_instance_num=-1,pipeline_dop=0,enable_adaptive_sink_dop=true,enable_runtime_adaptive_dop=false
 - Collect Profile Time: 0
Planner:
- Analyzer: 0ms / 1
- CTEUniqueChecker: 0ms / 1
- ColumnReuseChecker: 0ms / 1
- CoordDeliverExec: 8ms / 1
- CoordPrepareExec: 0ms / 1
- InputDependenciesChecker: 0ms / 1
- InsertPlanner: 1ms / 1
- Optimizer: 0ms / 1
- PlanBuilder: 0ms / 1
- Total: 3ms / 1
- Transform: 0ms / 1
- TypeChecker: 0ms / 1
Optimizer:
- CostBaseOptimize: 0ms / 1
- PhysicalRewrite: 0ms / 1
- PlanValidate: 0ms / 1
- RuleBaseOptimize: 0ms / 1
- preprocessMvs: 0ms / 1
Execution Profile e22f548f-b367-11ee-9c4f-005056ad08a8:
- QueryAllocatedMemoryUsage: 160.86 KB
- QueryCumulativeCpuTime: 423.324us
- QueryCumulativeOperatorTime: 1.258ms
- QueryDeallocatedMemoryUsage: 153.36 KB
- QueryPeakMemoryUsage: 48.63 KB
Fragment 0:
- BackendAddresses: 172.18.1.22:9060
- BackendNum: 1
- FragmentInstancePrepareTime: 2.130ms
- prepare-fragment-ctx: 32.615us
- prepare-pipeline-driver: 431.170us
- prepare-query-ctx: 12.371us
- prepare-runtime-state: 431.170us
- InstanceAllocatedMemoryUsage: 160.86 KB
- InstanceDeallocatedMemoryUsage: 153.36 KB
- InstanceNum: 1
- InstancePeakMemoryUsage: 13.39 KB
- QueryMemoryLimit: 10.00 GB
Pipeline (id=1):
- ActiveTime: 219.188us
- __MAX_OF_ActiveTime: 793.374us
- __MIN_OF_ActiveTime: 21.300us
- BlockByInputEmpty: 0
- BlockByOutputFull: 0
- BlockByPrecondition: 0
- DegreeOfParallelism: 5
- DriverPrepareTime: 625.982us
- __MAX_OF_DriverPrepareTime: 1.12ms
- __MIN_OF_DriverPrepareTime: 478.858us
- DriverTotalTime: 1s626ms
- __MAX_OF_DriverTotalTime: 8s58ms
- __MIN_OF_DriverTotalTime: 13.92ms
- GlobalScheduleCount: 961
- __MAX_OF_GlobalScheduleCount: 927
- __MIN_OF_GlobalScheduleCount: 7
- GlobalScheduleTime: 372.288ms
- __MAX_OF_GlobalScheduleTime: 1s855ms
- __MIN_OF_GlobalScheduleTime: 1.517ms
- OverheadTime: 11.389us
- __MAX_OF_OverheadTime: 49.599us
- __MIN_OF_OverheadTime: 0ns
- PendingTime: 1s623ms
- __MAX_OF_PendingTime: 8s57ms
- __MIN_OF_PendingTime: 7.635ms
- InputEmptyTime: 21.803us
- __MAX_OF_InputEmptyTime: 26.166us
- __MIN_OF_InputEmptyTime: 16.816us
- FirstInputEmptyTime: 21.803us
- __MAX_OF_FirstInputEmptyTime: 26.166us
- __MIN_OF_FirstInputEmptyTime: 16.816us
- FollowupInputEmptyTime: 0ns
- OutputFullTime: 682.318us
- __MAX_OF_OutputFullTime: 694.233us
- __MIN_OF_OutputFullTime: 658.22us
- PendingFinishTime: 1s623ms
- __MAX_OF_PendingFinishTime: 8s56ms
- __MIN_OF_PendingFinishTime: 6.915ms
- PreconditionBlockTime: 0ns
- ScheduleCount: 5
- __MAX_OF_ScheduleCount: 1
- __MIN_OF_ScheduleCount: 1
- ScheduleTime: 2.342ms
- __MAX_OF_ScheduleTime: 5.435ms
- __MIN_OF_ScheduleTime: 168.643us
- TotalDegreeOfParallelism: 5
- YieldByPreempt: 0
- YieldByTimeLimit: 0
OLAP_TABLE_SINK:
CommonMetrics:
- CloseTime: 79.187us
- __MAX_OF_CloseTime: 100.278us
- __MIN_OF_CloseTime: 59.381us
- OperatorAllocatedMemoryUsage: 116.87 KB
- __MAX_OF_OperatorAllocatedMemoryUsage: 84.55 KB
- __MIN_OF_OperatorAllocatedMemoryUsage: 8.08 KB
- OperatorDeallocatedMemoryUsage: 84.84 KB
- __MAX_OF_OperatorDeallocatedMemoryUsage: 75.40 KB
- __MIN_OF_OperatorDeallocatedMemoryUsage: 2.36 KB
- OperatorPeakMemoryUsage: 25.97 KB
- __MAX_OF_OperatorPeakMemoryUsage: 25.97 KB
- __MIN_OF_OperatorPeakMemoryUsage: 5.72 KB
- OperatorTotalTime: 232.916us
- __MAX_OF_OperatorTotalTime: 825.565us
- __MIN_OF_OperatorTotalTime: 61.196us
- PrepareTime: 569.4us
- __MAX_OF_PrepareTime: 958.518us
- __MIN_OF_PrepareTime: 414.681us
- PullChunkNum: 0
- PullRowNum: 0
- PullTotalTime: 0ns
- PushChunkNum: 1
- __MAX_OF_PushChunkNum: 1
- __MIN_OF_PushChunkNum: 0
- PushRowNum: 1
- __MAX_OF_PushRowNum: 1
- __MIN_OF_PushRowNum: 0
- PushTotalTime: 75.310us
- __MAX_OF_PushTotalTime: 376.551us
- __MIN_OF_PushTotalTime: 0ns
- SetFinishedTime: 133ns
- __MAX_OF_SetFinishedTime: 246ns
- __MIN_OF_SetFinishedTime: 44ns
- SetFinishingTime: 78.285us
- __MAX_OF_SetFinishingTime: 389.481us
- __MIN_OF_SetFinishingTime: 296ns
UniqueMetrics:
- AutomaticPartition: false
- IndexNum: 1
- ReplicatedStorage: true
- TxnID: 8273909
- AllocAutoIncrementTime: 54ns
- __MAX_OF_AllocAutoIncrementTime: 272ns
- __MIN_OF_AllocAutoIncrementTime: 0ns
- CloseWaitTime: 5.97ms
- __MAX_OF_CloseWaitTime: 5.179ms
- __MIN_OF_CloseWaitTime: 5.70ms
- OpenTime: 0ns
- PrepareDataTime: 25.839us
- __MAX_OF_PrepareDataTime: 129.199us
- __MIN_OF_PrepareDataTime: 0ns
- ConvertChunkTime: 12.663us
- __MAX_OF_ConvertChunkTime: 63.316us
- __MIN_OF_ConvertChunkTime: 0ns
- ValidateDataTime: 12.94us
- __MAX_OF_ValidateDataTime: 60.471us
- __MIN_OF_ValidateDataTime: 0ns
- RowsFiltered: 0
- RowsRead: 1
- __MAX_OF_RowsRead: 1
- __MIN_OF_RowsRead: 0
- RowsReturned: 1
- __MAX_OF_RowsReturned: 1
- __MIN_OF_RowsReturned: 0
- RpcClientSideTime: 1s611ms
- __MAX_OF_RpcClientSideTime: 8s51ms
- __MIN_OF_RpcClientSideTime: 1.740ms
- RpcServerSideTime: 1s609ms
- __MAX_OF_RpcServerSideTime: 8s46ms
- __MIN_OF_RpcServerSideTime: 1000ns
- SendDataTime: 43.341us
- __MAX_OF_SendDataTime: 216.708us
- __MIN_OF_SendDataTime: 0ns
- PackChunkTime: 6.886us
- __MAX_OF_PackChunkTime: 34.431us
- __MIN_OF_PackChunkTime: 0ns
- SendRpcTime: 59.846us
- __MAX_OF_SendRpcTime: 112.741us
- __MIN_OF_SendRpcTime: 12.24us
- CompressTime: 0ns
- SerializeChunkTime: 5.901us
- __MAX_OF_SerializeChunkTime: 29.507us
- __MIN_OF_SerializeChunkTime: 0ns
- WaitResponseTime: 0ns
LOCAL_EXCHANGE_SOURCE (pseudo_plan_node_id=-100):
CommonMetrics:
- CloseTime: 727ns
- __MAX_OF_CloseTime: 1.275us
- __MIN_OF_CloseTime: 347ns
- OperatorAllocatedMemoryUsage: 5.63 KB
- __MAX_OF_OperatorAllocatedMemoryUsage: 1.13 KB
- __MIN_OF_OperatorAllocatedMemoryUsage: 1.13 KB
- OperatorDeallocatedMemoryUsage: 5.63 KB
- __MAX_OF_OperatorDeallocatedMemoryUsage: 1.13 KB
- __MIN_OF_OperatorDeallocatedMemoryUsage: 1.13 KB
- OperatorPeakMemoryUsage: 0.00
- OperatorTotalTime: 4.466us
- __MAX_OF_OperatorTotalTime: 11.219us
- __MIN_OF_OperatorTotalTime: 1.359us
- PrepareTime: 21.142us
- __MAX_OF_PrepareTime: 26.69us
- __MIN_OF_PrepareTime: 17.921us
- PullChunkNum: 1
- __MAX_OF_PullChunkNum: 1
- __MIN_OF_PullChunkNum: 0
- PullRowNum: 1
- __MAX_OF_PullRowNum: 1
- __MIN_OF_PullRowNum: 0
- PullTotalTime: 1.560us
- __MAX_OF_PullTotalTime: 7.804us
- __MIN_OF_PullTotalTime: 0ns
- PushChunkNum: 0
- PushRowNum: 0
- PushTotalTime: 0ns
- SetFinishedTime: 1.962us
- __MAX_OF_SetFinishedTime: 4.363us
- __MIN_OF_SetFinishedTime: 616ns
- SetFinishingTime: 215ns
- __MAX_OF_SetFinishingTime: 390ns
- __MIN_OF_SetFinishingTime: 92ns
UniqueMetrics:
Pipeline (id=0):
- ActiveTime: 421.128us
- BlockByInputEmpty: 0
- BlockByOutputFull: 0
- BlockByPrecondition: 0
- DegreeOfParallelism: 1
- DriverPrepareTime: 100.564us
- DriverTotalTime: 484.185us
- GlobalScheduleCount: 1
- GlobalScheduleTime: 421.128us
- OverheadTime: 0ns
- PendingTime: 0ns
- InputEmptyTime: 0ns
- FirstInputEmptyTime: 0ns
- FollowupInputEmptyTime: 0ns
- OutputFullTime: 0ns
- PendingFinishTime: 0ns
- PreconditionBlockTime: 0ns
- ScheduleCount: 1
- ScheduleTime: 63.57us
- TotalDegreeOfParallelism: 1
- YieldByPreempt: 0
- YieldByTimeLimit: 0
LOCAL_EXCHANGE_SINK (pseudo_plan_node_id=-100):
CommonMetrics:
- CloseTime: 419ns
- OperatorAllocatedMemoryUsage: 0.00
- OperatorDeallocatedMemoryUsage: 0.00
- OperatorPeakMemoryUsage: 0.00
- OperatorTotalTime: 16.511us
- PrepareTime: 21.719us
- PullChunkNum: 0
- PullRowNum: 0
- PullTotalTime: 0ns
- PushChunkNum: 1
- PushRowNum: 1
- PushTotalTime: 15.20us
- SetFinishedTime: 79ns
- SetFinishingTime: 993ns
UniqueMetrics:
- Type: Passthrough
- ShuffleNum: 5
- LocalExchangePeakMemoryUsage: 2.13 KB
UNION_CONST_SOURCE (plan_node_id=0):
CommonMetrics:
- CloseTime: 14.541us
- OperatorAllocatedMemoryUsage: 40.94 KB
- OperatorDeallocatedMemoryUsage: 27.55 KB
- OperatorPeakMemoryUsage: 13.38 KB
- OperatorTotalTime: 405.110us
- PrepareTime: 22.848us
- PullChunkNum: 1
- PullRowNum: 1
- PullTotalTime: 390.185us
- PushChunkNum: 0
- PushRowNum: 0
- PushTotalTime: 0ns
- RuntimeBloomFilterNum: 0
- RuntimeInFilterNum: 0
- SetFinishedTime: 101ns
- SetFinishingTime: 283ns
UniqueMetrics: