【详述】
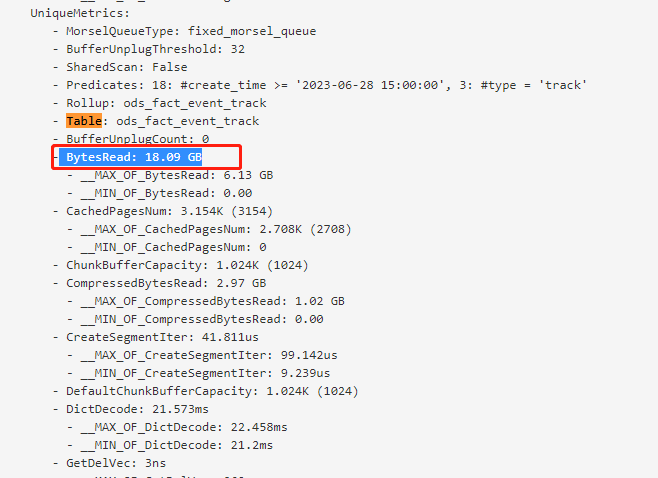
使用udf函数计算后,如果过滤的是udf计算得到的值的话,执行会很慢,如果过滤的是非udf计算得到的值的话,执行就很快。
udf函数名:check_properties(string, string)
执行语句:
- 最外层 where 条件如果不跟udf函数有关的话,执行很快1.5s左右,count结果为 55960132
select count(1) from (
select
#time
,#event
, check_result
, properties as json_sample
from (
select *,check_properties(
(
select str
from (select event,GROUP_CONCAT(concat(column_name,’:’,data_type),’,’) as str from bi_bury_event_attribute_v
where table_name != ‘ods_event_user’ and starts_with(event, ‘#’) = 0 and starts_with(event, ‘rx’) = 0
group by event) t
where s.#event = t.event
)
,properties) as check_result
from ods_fact_event_track s
where #create_time >= ‘2023-06-27 14:00:00’ and #type = ‘track’ and #event in (select event from bi_bury_event_attribute_v where table_name != ‘ods_event_user’ and starts_with(event, ‘#’) = 0 and starts_with(event, ‘rx’) = 0) ) t
) t
where #event is not null
;
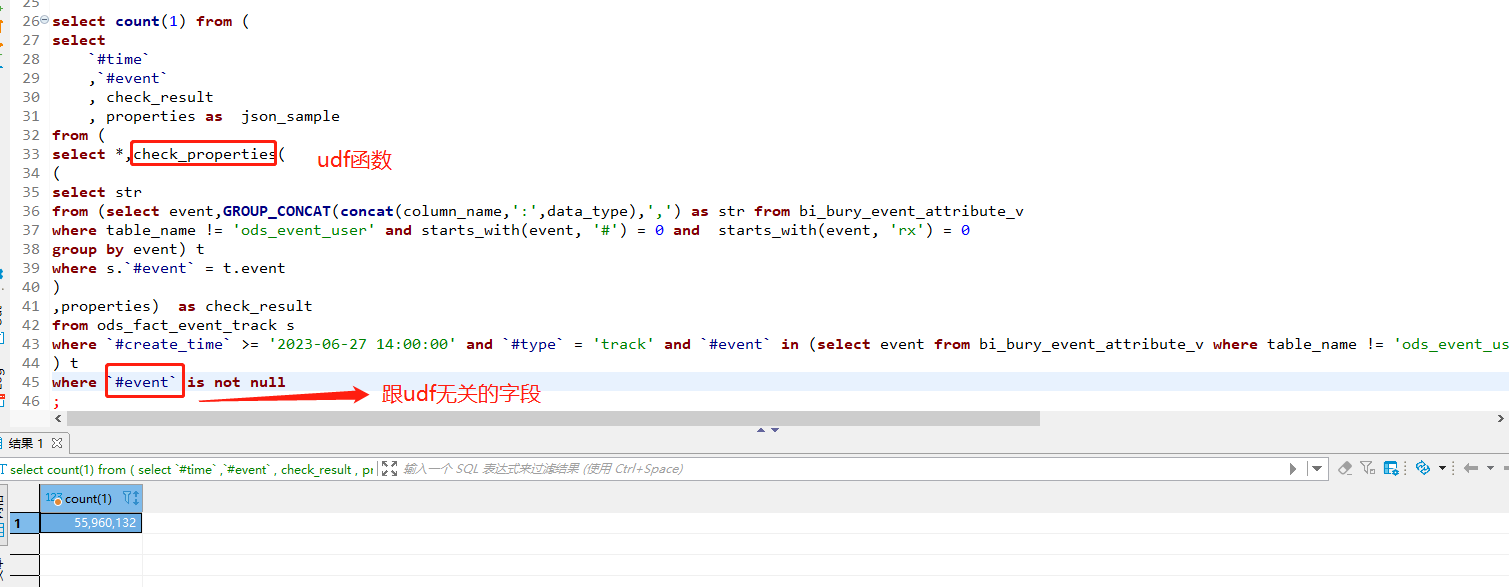
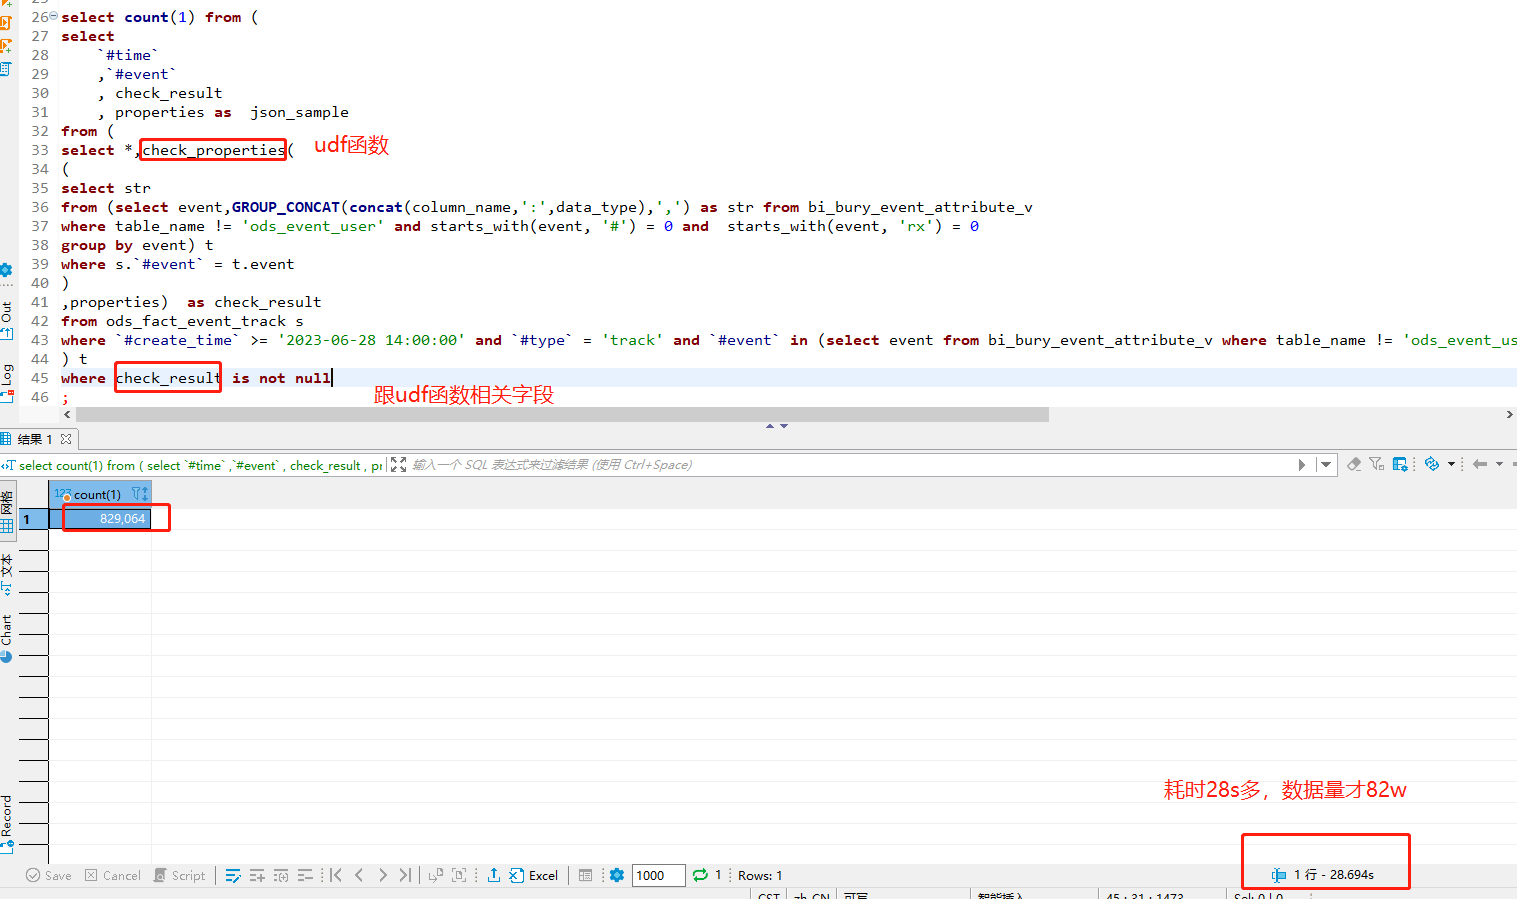
- 最外层 where 条件如果跟udf函数有关的话,执行很慢,基本执行不出来。少数据量还能勉强计算出来,count为 829064时,计算时间为28s左右。差距太大了。
select count(1) from (
select
#time
,#event
, check_result
, properties as json_sample
from (
select *,check_properties(
(
select str
from (select event,GROUP_CONCAT(concat(column_name,’:’,data_type),’,’) as str from bi_bury_event_attribute_v
where table_name != ‘ods_event_user’ and starts_with(event, ‘#’) = 0 and starts_with(event, ‘rx’) = 0
group by event) t
where s.#event = t.event
)
,properties) as check_result
from ods_fact_event_track s
where #create_time >= ‘2023-06-28 14:00:00’ and #type = ‘track’ and #event in (select event from bi_bury_event_attribute_v where table_name != ‘ods_event_user’ and starts_with(event, ‘#’) = 0 and starts_with(event, ‘rx’) = 0) ) t
) t
where check_result is not null
;
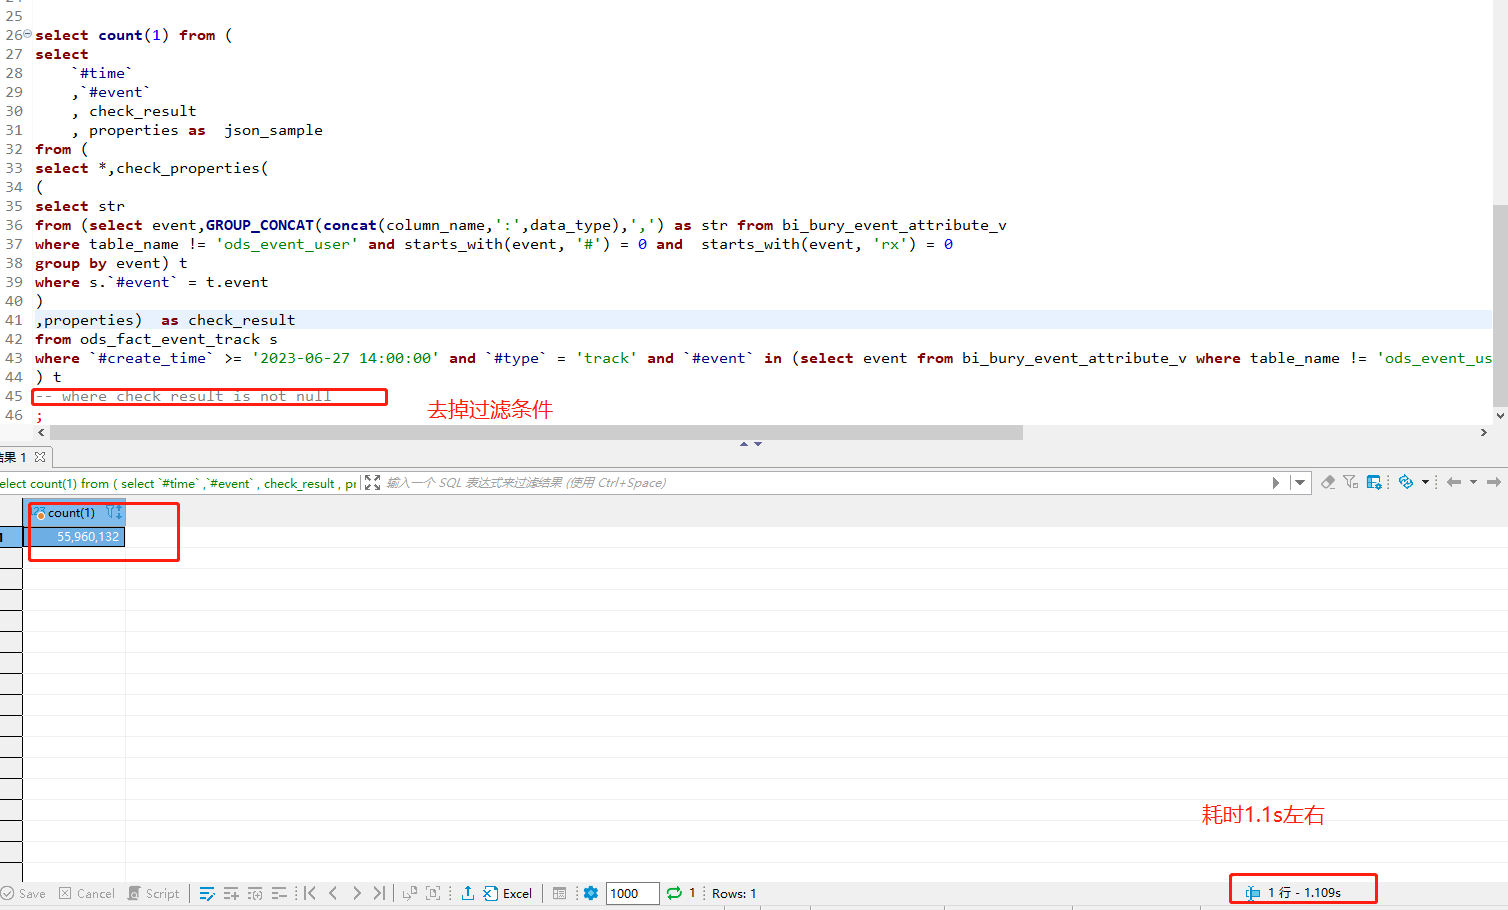
- 不加任何筛选条件的时候,跟第一种情况一致,55960132 数据量下执行也才1.2s左右
【背景】
【业务影响】
【StarRocks版本】2.5.4
【集群规模】3fe + 3be