
Query:
Summary:
- Query ID: 5111bf54-953b-11ed-a289-525400d55bc5
- Start Time: 2023-01-15 20:15:51
- End Time: 2023-01-15 20:16:16
- Total: 24s703ms
- Query Type: Query
- Query State: EOF
- StarRocks Version: 2.5.0-RC02-394fb80
- User: root
- Default Db: data_cockpit
- Sql Statement: select * from ods_mj_event_door
- QueryCpuCost: 0
- QueryMemCost: 0.000
- Variables: parallel_fragment_exec_instance_num=1,pipeline_dop=0,enable_adaptive_sink_dop=true
- Collect Profile Time: 1ms
Planner:
- Analyzer: 9ms / 1
- CoordDeliverExec: 2036ms / 1
- CoordPrepareExec: 8ms / 1
- ExecPlanBuild: 36ms / 1
- Optimizer: 141ms / 1
- Total: 219ms / 1
Optimizer:
- CostBaseOptimize: 33ms / 1
- PhysicalRewrite: 8ms / 1
- RuleBaseOptimize: 38ms / 1
Execution Profile 5111bf54-953b-11ed-a289-525400d55bc5:(Active: 24s698ms[24698882637ns], % non-child: 100.00%)
Fragment 0:
Instance 5111bf54-953b-11ed-a289-525400d55bc6 (host=TNetworkAddress(hostname:192.168.100.147, port:9060)):(Active: 22s278ms[22278175823ns], % non-child: 87.86%)
- Address: 192.168.100.147:9060
- MemoryLimit: 2.00 GB
- PeakMemoryUsage: 12.97 MB
- RowsProduced: 816.934K (816934)
DataBufferSender (dst_fragment_instance_id=5111bf54-953b-11ed-a289-525400d55bc6):
- AppendChunkTime: 2s810ms
- ResultRendTime: 18s880ms
- TupleConvertTime: 2s798ms
- NumSentRows: 816.934K (816934)
OLAP_SCAN_NODE (id=0):(Active: 577.902ms[577902258ns], % non-child: 0.00%)
- Table: ods_mj_event_door
- Rollup: ods_mj_event_door
- BytesRead: 221.96 MB
- IOTaskCount : 1
- NumDiskAccess: 0
- PeakMemoryUsage: 0.00
- RowsRead: 816.934K (816934)
- RowsReturned: 816.934K (816934)
- RowsReturnedRate: 1.413619M /sec
- ScanConcurrency : 1
- ScanTime: 1s14ms
- ScannerThreadsInvoluntaryContextSwitches: 0
- ScannerThreadsTotalWallClockTime: 0ns
- MaterializeTupleTime(): 0ns
- ScannerThreadsSysTime: 0ns
- ScannerThreadsUserTime: 0ns
- ScannerThreadsVoluntaryContextSwitches: 0
- TabletCount : 1
- TotalRawReadTime(): 0ns
- TotalReadThroughput: 384.08166313171387 MB/sec
SCAN:(Active: 1s11ms[1011501203ns], % non-child: 4.10%)
- CachedPagesNum: 1
- CompressedBytesRead: 56.26 MB
- CreateSegmentIter: 175.816us
- GetDelVec: 126.508us
- GetRowsets: 41.7ms
- IOTime: 400.655ms
- PushdownPredicates: 0
- RawRowsRead: 816.934K (816934)
- ReadPagesNum: 2.642K (2642)
- SegmentInit: 125.96ms
- BitmapIndexFilter: 0ns
- BitmapIndexFilterRows: 0
- BloomFilterFilterRows: 0
- SegmentRuntimeZoneMapFilterRows: 0
- SegmentZoneMapFilterRows: 0
- ShortKeyFilterRows: 0
- ZoneMapIndexFilterRows: 0
- SegmentRead: 885.504ms
- BlockFetch: 819.137ms
- BlockFetchCount: 200
- BlockSeek: 72.134ms
- BlockSeekCount: 2.596K (2596)
- ChunkCopy: 0ns
- DecompressT: 6.80ms
- DelVecFilterRows: 0
- IndexLoad: 0ns
- PredFilter: 0ns
- PredFilterRows: 0
- RowsetsReadCount: 1
- SegmentsReadCount: 1
- TotalColumnsDataPageCount: 2.634K (2634)
- UncompressedBytesRead: 57.55 MB
例2
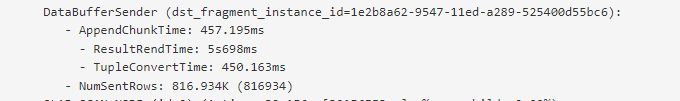
ResultRendTime总是占95%左右的时间,这个参数是啥,官网也找不到内容,求解?
ResultRendTime就是结果发送给客户端的时间,是不是返回的数据量太大或者是网络原因。
客户端在外网吧,这个受限于网络和客户端的性能。