
【StarRocks版本】例如:2.2.2
【集群规模】例如:3fe(3 follower)+8be
【机器信息】CPU虚拟核/内存/网卡,例如:40C/192G/千兆
【附件】
- 慢查询:
- Profile信息
- 并行度:show variables like ‘%parallel_fragment_exec_instance_num%’;
parallel_fragment_exec_instance_num 20 - cbo是否开启:show variables like ‘%cbo%’;
cbo_cte_reuse false
cbo_enable_dp_join_reorder true
cbo_enable_greedy_join_reorder true
cbo_enable_low_cardinality_optimize true
cbo_enable_replicated_join true
cbo_max_reorder_node_use_dp 10
cbo_max_reorder_node_use_exhaustive 4
cbo_use_correlated_join_estimate true - be节点cpu和内存使用率截图
观察了io,内存,网络,cpu负载都不高。
执行的sql:
set new_planner_agg_stage=3;
select user_type,count(distinct user_id) from dwd.socialmedia_user_type group by user_type;
因当前版本pipeline性能有问题,已经关闭。
enable_pipeline_engine false
pipeline_dop 0
pipeline_profile_level 1
统计信息每天定时收集
表结构如下(数据量5千多万):
CREATE TABLE socialmedia_user_type (
platform_id int(11) NULL COMMENT “”,
user_id varchar(65533) NULL COMMENT “”,
user_type int(11) NULL COMMENT “”
) ENGINE=OLAP
UNIQUE KEY(platform_id, user_id)
COMMENT “OLAP”
DISTRIBUTED BY HASH(platform_id, user_id) BUCKETS 16
PROPERTIES (
“replication_num” = “3”,
“in_memory” = “false”,
“storage_format” = “DEFAULT”
);
explain:
PLAN FRAGMENT 0
OUTPUT EXPRS:3: user_type | 4: count
PARTITION: UNPARTITIONED
RESULT SINK
5:EXCHANGE
PLAN FRAGMENT 1
OUTPUT EXPRS:
PARTITION: HASH_PARTITIONED: 3: user_type
STREAM DATA SINK
EXCHANGE ID: 05
UNPARTITIONED
4:AGGREGATE (update finalize)
| output: count(2: user_id)
| group by: 3: user_type
|
3:AGGREGATE (merge serialize)
| group by: 2: user_id, 3: user_type
|
2:EXCHANGE
PLAN FRAGMENT 2
OUTPUT EXPRS:
PARTITION: RANDOM
STREAM DATA SINK
EXCHANGE ID: 02
HASH_PARTITIONED: 3: user_type
1:AGGREGATE (update serialize)
| STREAMING
| group by: 2: user_id, 3: user_type
|
0:OlapScanNode
TABLE: socialmedia_user_type
PREAGGREGATION: OFF. Reason: Group columns isn’t Key column
partitions=1/1
rollup: socialmedia_user_type
tabletRatio=16/16
tabletList=215679,215683,215687,215691,215695,215699,215703,215707,215711,215715 …
cardinality=102373655
avgRowSize=21.75865
numNodes=0
sql执行的profile文件:
query_profile (113.7 KB)
通过./healthy_report config.ini检查tablet的情况:

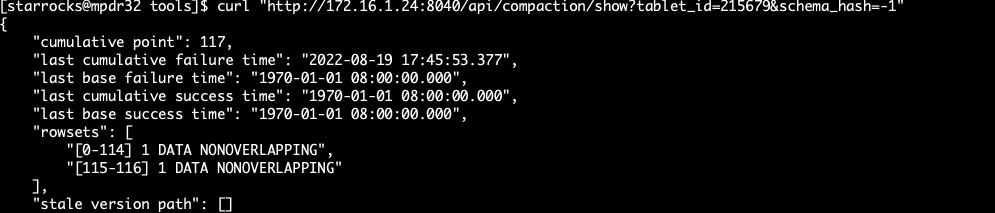
其中一个tablet rowset情况:
通过profile发现有两个指标非常耗时:

还请官方的同学协助一下,感谢!